predict your trading day in the first 15 minutes using the market open volume report
how to know if today is worth trading before most traders have had their first coffee
what if you could look at just the first 15-30 minutes of trading and accurately predict:
- if today will be high or low volume
- whether the day will close green or red
- if price will break yesterday's high or low
this isn't market prediction based on gut feelings or complex indicators - it's statistical probability based on actual market data.
in this post, I'm going to show you exactly how to combine three powerful edgeful reports to determine within the first hour whether a day is worth trading at all - and if it is, exactly what direction and targets to trade for.
the market open volume report: predicting daily volatility
the market open volume report is one of our most straightforward yet powerful tools. it measures the correlation between the volume in the first 15 minutes of trading (9:30-9:45AM ET) and the volume for the rest of the day (9:45AM-4:00PM ET).
for those who don't remember from stats class, correlations range from -1 to +1:
- +1 means a perfect positive relationship
- -1 means a perfect negative relationship
- 0 means no relationship at all
here's what the data shows on YM (dow futures) over the past 3 months:
the correlation between the first 15 minutes of volume and the rest of the day's volume is 0.76 - an extremely strong relationship. anything above 0.7 is considered very reliable in statistics.
what this means is simple:
if volume is significantly higher than average in the first 15 minutes, you can expect volume to remain high throughout the day. if volume is much lower than average in the first 15 minutes, the rest of the day will likely have low volume as well.
translating the numbers to practical trading rules
on YM:
- the average volume in the first 15 minutes over the past 3 months is 9,451 contracts
- the average volume for the rest of the day is about 78,900 contracts
if you see the first 15 minutes with volume of 19,000 (double the average), you can expect the rest of the day to trade more than the average of 78,000. the same applies in reverse for low volume days.
to check this on your own charts, use a 15-minute timeframe and the TradingView volume indicator. make sure you have market data subscription on your charting platform to receive accurate volume data.
a real-world example from Thursday, April 10th
the first 15 minutes during the NY session traded 11.76k contracts on YM, which is over 20% higher than the 3-month average according to our market open volume report.
based on this data alone, your expectation should be for total volume to be well above the 78.9k contract average for the day.
customizing the analysis period
every edgeful report allows you to customize inputs to match your trading style. with the market open volume report, you can change the volume analysis period to the first 5, 15, or 30 minutes:
- scalpers might prefer the 5-minute volume analysis
- day traders can use either the 15 or 30-minute intervals to let the opening range develop
why opening volume matters: high vs. low volume environments
understanding whether you're in a high or low volume environment is crucial because it fundamentally changes how price behaves.
high volume days typically lead to:
- cleaner directional moves
- more reliable continuation patterns
- stronger momentum
- more decisive breakouts
- better respect of key levels
low volume days often create:
- choppy, whipsaw price action
- false breakouts and breakdowns
- more range-bound conditions
- trapping price action that hunts stops in both directions
comparing two different volume environments
here's a perfect example from February 4th, 2025 on YM:
on this day, the first 15 minutes showed volume at just 7.4k contracts - about 75% of the average. the correlation told us to expect a very low volume day, and that's exactly what happened.
notice the price action - no real move in either direction, which would have made trading any size or looking for a clear trend frustrating. this is the kind of day where most traders get chopped around and lose money regardless of strategy.
now contrast that with February 22nd, 2025, where opening volume was 11.5k contracts (almost 125% of the average):
the price action was completely different - a clean trend that developed early and continued all day, with minimal retracements and excellent follow-through. this is the kind of day where good traders make the majority of their monthly profits.
this is why it's important to know what type of environment you thrive in - low liquidity or high liquidity - and then trade according to what the market open volume stats are telling you.
adding direction: the opening candle continuation report
now that we can predict the volume environment, we need to determine which direction the market is likely to move. this is where the opening candle continuation (OCC) report comes in.
the OCC report measures how often the color of the opening period - usually the first hour of trading - matches the color of the entire session.
here are the OCC stats on YM over the past 3 months:
- if the first hour closes green, the session closes green 72% of the time
- if the first hour closes red, the session closes red 70% of the time
these are very strong probabilities that give us a clear directional bias for the day.
combining volume and direction
once you've determined whether it's likely to be a high or low volume day using the market open volume report, you can use the OCC to add directional bias to your analysis:
on high volume days:
- if the first hour candle is green: expect a clear bullish trend with good follow-through
- if the first hour candle is red: expect a clear bearish trend with good follow-through
on low volume days:
- if the first hour candle is green or red: be cautious about expecting strong directional moves
- direction is less important than the fact that moves are likely to be choppy and range-bound
this simple combination tells you not just the expected direction of the day, but also the quality of the moves you're likely to see.
setting precise targets: the inside bars report
we now have volume and direction covered. the final piece is adding specific price targets using the inside bars report.
the inside bars report tells us what happens when price opens within the previous day's range. specifically, it measures how often price breaks out of yesterday's range by the end of the session.
on YM over the last 3 months:
when price opens within yesterday's range:
- it breaks either yesterday's high or low 82.5% of the time
- it stays completely within yesterday's range only 17.5% of the time
these high-probability numbers give us specific levels to target based on our directional bias:
- if your OCC bias is bullish (green first hour candle):
- target yesterday's high if price opened within yesterday's range
- expect a break of this level with high probability
- if your OCC bias is bearish (red first hour candle):
- target yesterday's low if price opened within yesterday's range
- expect a break of this level with high probability
the quality of the move toward these targets will be heavily influenced by the volume environment:
on high volume days:
- expect cleaner, more direct moves toward the targets
- more likely to see strong continuation once the target is reached
on low volume days:
- expect choppy, less direct moves toward the targets
- more likely to see false breakouts or failure at the targets
building your complete trading plan: the 3-report system
here's how to use these three reports together to build a comprehensive trading plan within the first hour of each day:
1. check the first 15-30 minutes of volume compared to the 3-month average
- if volume is significantly higher than average (>20%): prepare for a directional day
- if volume is significantly lower than average (<20%): prepare for a choppy, range-bound day
2. wait for the first hour of trading to complete (10:30AM ET)
- check the color of the first hour candle
- if green: expect bullish bias for the day (72% probability)
- if red: expect bearish bias for the day (70% probability)
3. identify targets using the inside bars report
- if bullish bias: target yesterday's high
- if bearish bias: target yesterday's low
4. adjust position sizing based on volume
- high volume + clear direction: larger size
- low volume or conflicting signals: smaller size or sit out
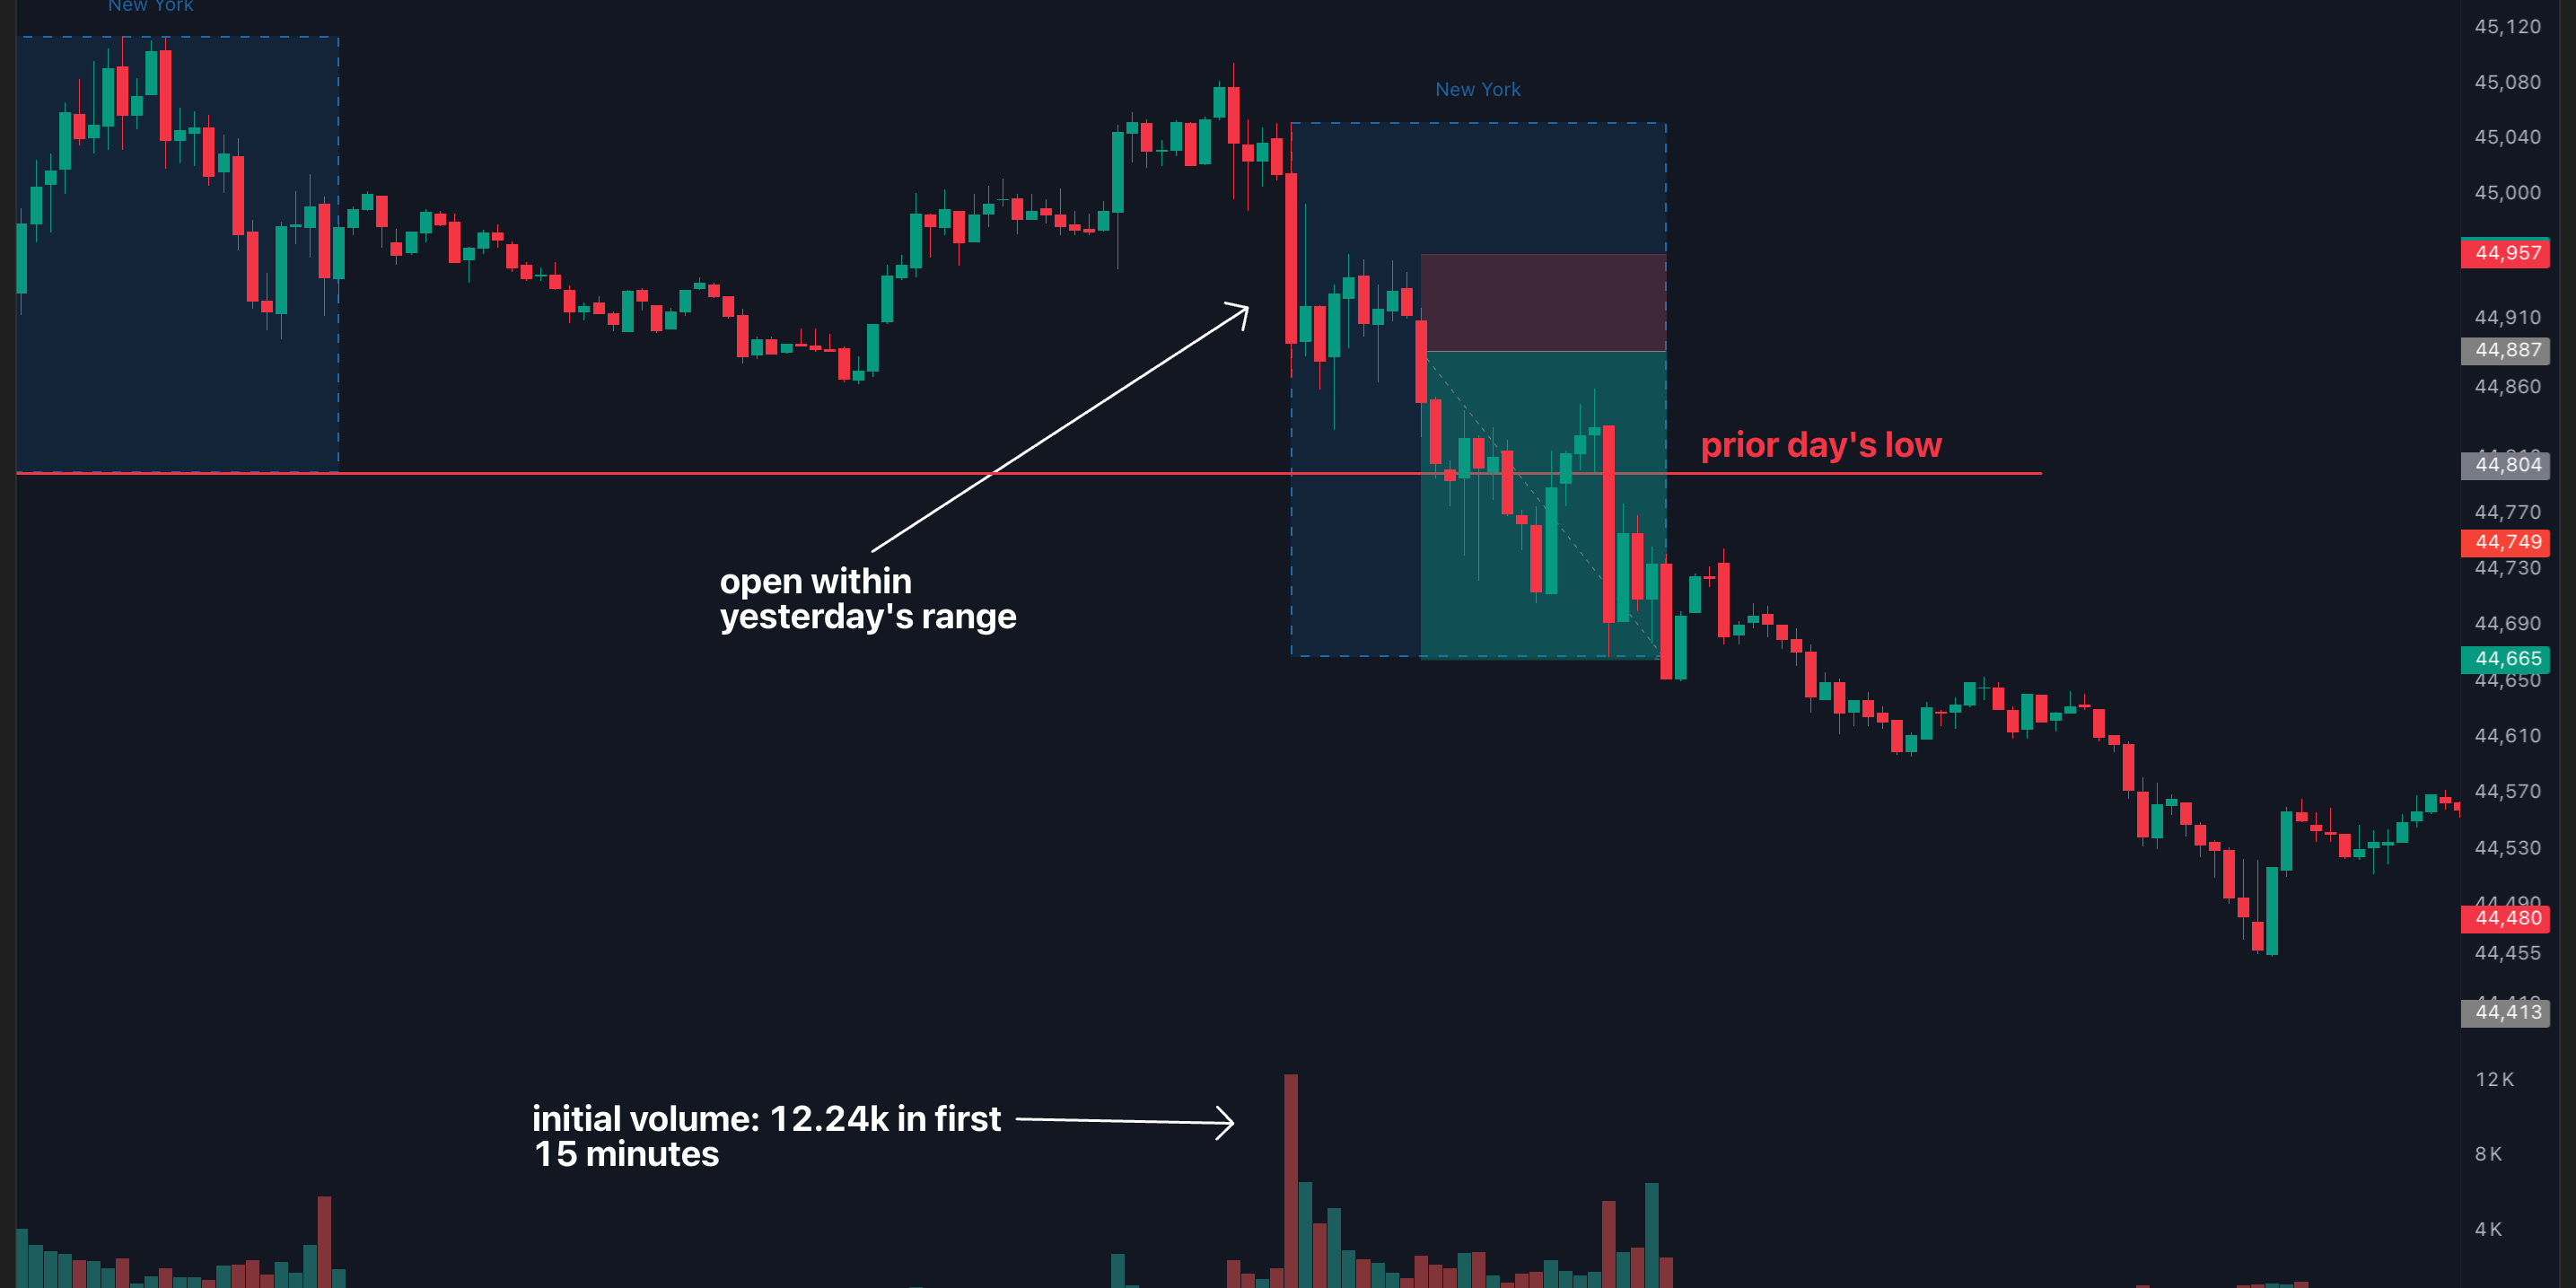
putting it all together: a real-world example
let's walk through a real example from November 14, 2024 on YM:
- first 15 minutes of volume: 12.24k contracts (significantly higher than average)
- first hour candle color: red
- price opened within yesterday's range
based on our three reports, we can build this trading plan:
- high volume tells us to expect a directional day with clean moves
- red first hour candle gives us a strong bearish bias (70% chance of a red close)
- yesterday's low becomes our initial target (82.5% chance of either high or low being broken)
- we expect the move toward this target to be clean and direct due to high volume
the result? YM moved steadily lower throughout the day, broke below yesterday's low with strong momentum, and closed near the lows of the day. traders who followed this plan would have caught a significant portion of a 200+ point move down.
knowing when not to trade: the most underrated edge
one of the most valuable aspects of this three-report system is that it clearly tells you when to stay out of the market.
if you see:
- low volume in the first 15-30 minutes
- unclear direction in the first hour (small candle or multiple reversals)
- price already near yesterday's high or low
these conditions suggest a day that's likely to be choppy, directionless, and full of false moves - exactly the kind of environment where most traders lose money.
the ability to identify these days early and sit them out completely can be just as valuable as knowing when and how to trade aggressively.
adapting to different instruments and timeframes
while we've focused on YM futures in this post, the same three-report approach works for any liquid instrument:
- individual stocks (especially high-volume names)
- other futures contracts (ES, NQ, CL, GC)
- forex pairs (during their most active sessions)
- crypto (during high-volume periods)
the key is to generate the specific statistics for your preferred trading instrument rather than blindly applying the YM numbers to everything. each market has its own unique characteristics and probabilities.
wrapping up: your first-hour trading blueprint
let's do a quick recap of what we covered today:
- use the market open volume report to predict if the day will be high or low volume
- use the opening candle continuation report (first hour) to determine directional bias
- use the inside bars report to set specific targets at yesterday's high or low
- combine all three for a complete trading plan with volume, direction, and targets
- adjust your position sizing based on the clarity of the signals
this triple-report combination acts like your personal quant, telling you within the first hour:
- if you should be trading at all
- which direction to trade
- where to target
- how aggressively to size
remember - the best traders know when not to trade, which direction to trade when they do, and exactly where their targets should be. with this data-driven approach, you'll be making decisions based on statistical probabilities rather than hope or emotion.
want to access these reports and analyze your favorite instruments? check out the market open volume report and more to start predicting your trading days with data.