edgeful's outside day gap fill strategy: a data-driven approach to trading reversals
what makes a powerful reversal strategy?
most traders look for continuation trades when they see price gapping up or down. they assume momentum will keep going in the same direction - but this is exactly why the majority of traders struggle.
the data tells us something completely different: when price opens outside of the previous day's range, it's actually more likely to reverse than continue.
in this post, I'm going to show you exactly how to combine three different reports to build a high-probability outside day gap fill reversal setup that can deliver 2R to 6R returns consistently.
the three key reports that create the outside day gap fill reversal
to build this powerful reversal strategy, we'll combine these three data-backed reports:
- the outside days report - shows when price is likely to reverse after opening outside yesterday's range
- the gap fill report - tells you how often gaps get filled to the prior session close
- the ICT midnight open retracement - a powerful level that price respects with surprising consistency
let's break down each report and see what the data tells us.
report #1: outside days report - the foundation of our reversal strategy
an outside day occurs when price opens outside of the previous day's range - either above yesterday's high or below yesterday's low.
here's what a bullish outside day looks like:
and here's a bearish outside day:
while most traders assume price will continue in the direction of the gap, the data on YM (dow futures) over the last 3 months shows:
- when price opens above yesterday's high — bullish outside day — it reverses back down to touch yesterday's high 67% of the time
- when price opens below yesterday's low — bearish outside day — it reverses back up to touch yesterday's low 78% of the time
and here's the data from the outside day report, directly from edgeful:
the market is essentially telling you that when price opens outside of yesterday’s range, it's much more likely to retrace back than to continue in the direction of the gap.
this goes against what most traders do — chasing momentum in the direction of the gap — and explains why so many people get caught on the wrong side of these moves.
using this data alone — even before we know how to enter a setup like this — you can see that yesterday’s high is a very strong, data-backed target (it gets hit 67% of the time when price gaps above yesterday’s high).
keep this in mind as we build on the outside day report:
report #2: gap fill report - adding another layer of confidence
the gap fill report measures how often price retraces back to the previous session's closing price after opening above or below it.
on YM over the last 3 months:
- gaps up fill 68% of the time
- gaps down fill 61% of the time
for our outside day gap fill reversal strategy, we're going to focus on gaps up since they have a higher probability of filling, and were also above 60% probability for a fill using the outside day report as well.
so what do the gap fill report stats mean for our reversal setup?
when price gaps up and opens above yesterday's close, 68% of the time over the last 3 months on YM, it retraces back down to “fill the gap”, meaning it touches the prior session’s close.
this tells you the prior session close is yet another strong, data-backed target for a reversal strategy, especially when it aligns with an outside day.
report #3: ICT midnight opening retracement - the surprise factor
regardless of your opinion on ICT methods, the data here is compelling. this report measures how often price during the NY session retraces back to touch the midnight opening candle (12AM ET).
on YM over the last 3 months:
- when price opened above the ICT midnight open, it retraced back down to touch that level 79% of the time
- when price opened below the ICT midnight open, it retraced back up to touch that level 66% of the time
like the outside days and gap fill reports, the data is showing us that price has a strong tendency to reverse back to this key level after opening away from it — yet again using data to build confidence in a trade target — instead of randomly choosing a level “just because”.
combining the reports: what makes an outside day gap fill reversal setup
when all three of these conditions align, you have what I call a high-probability outside day gap fill reversal setup:
- price opens as a bullish outside day - above yesterday's high
- there's a gap up - price opens above yesterday's close
- price opens above the ICT midnight open
instead of having just one report with 60-70% probability, you now have three reports all confirming the same bias - dramatically increasing your confidence to take the trade.
a real-world example: March 3, 2025 on YM
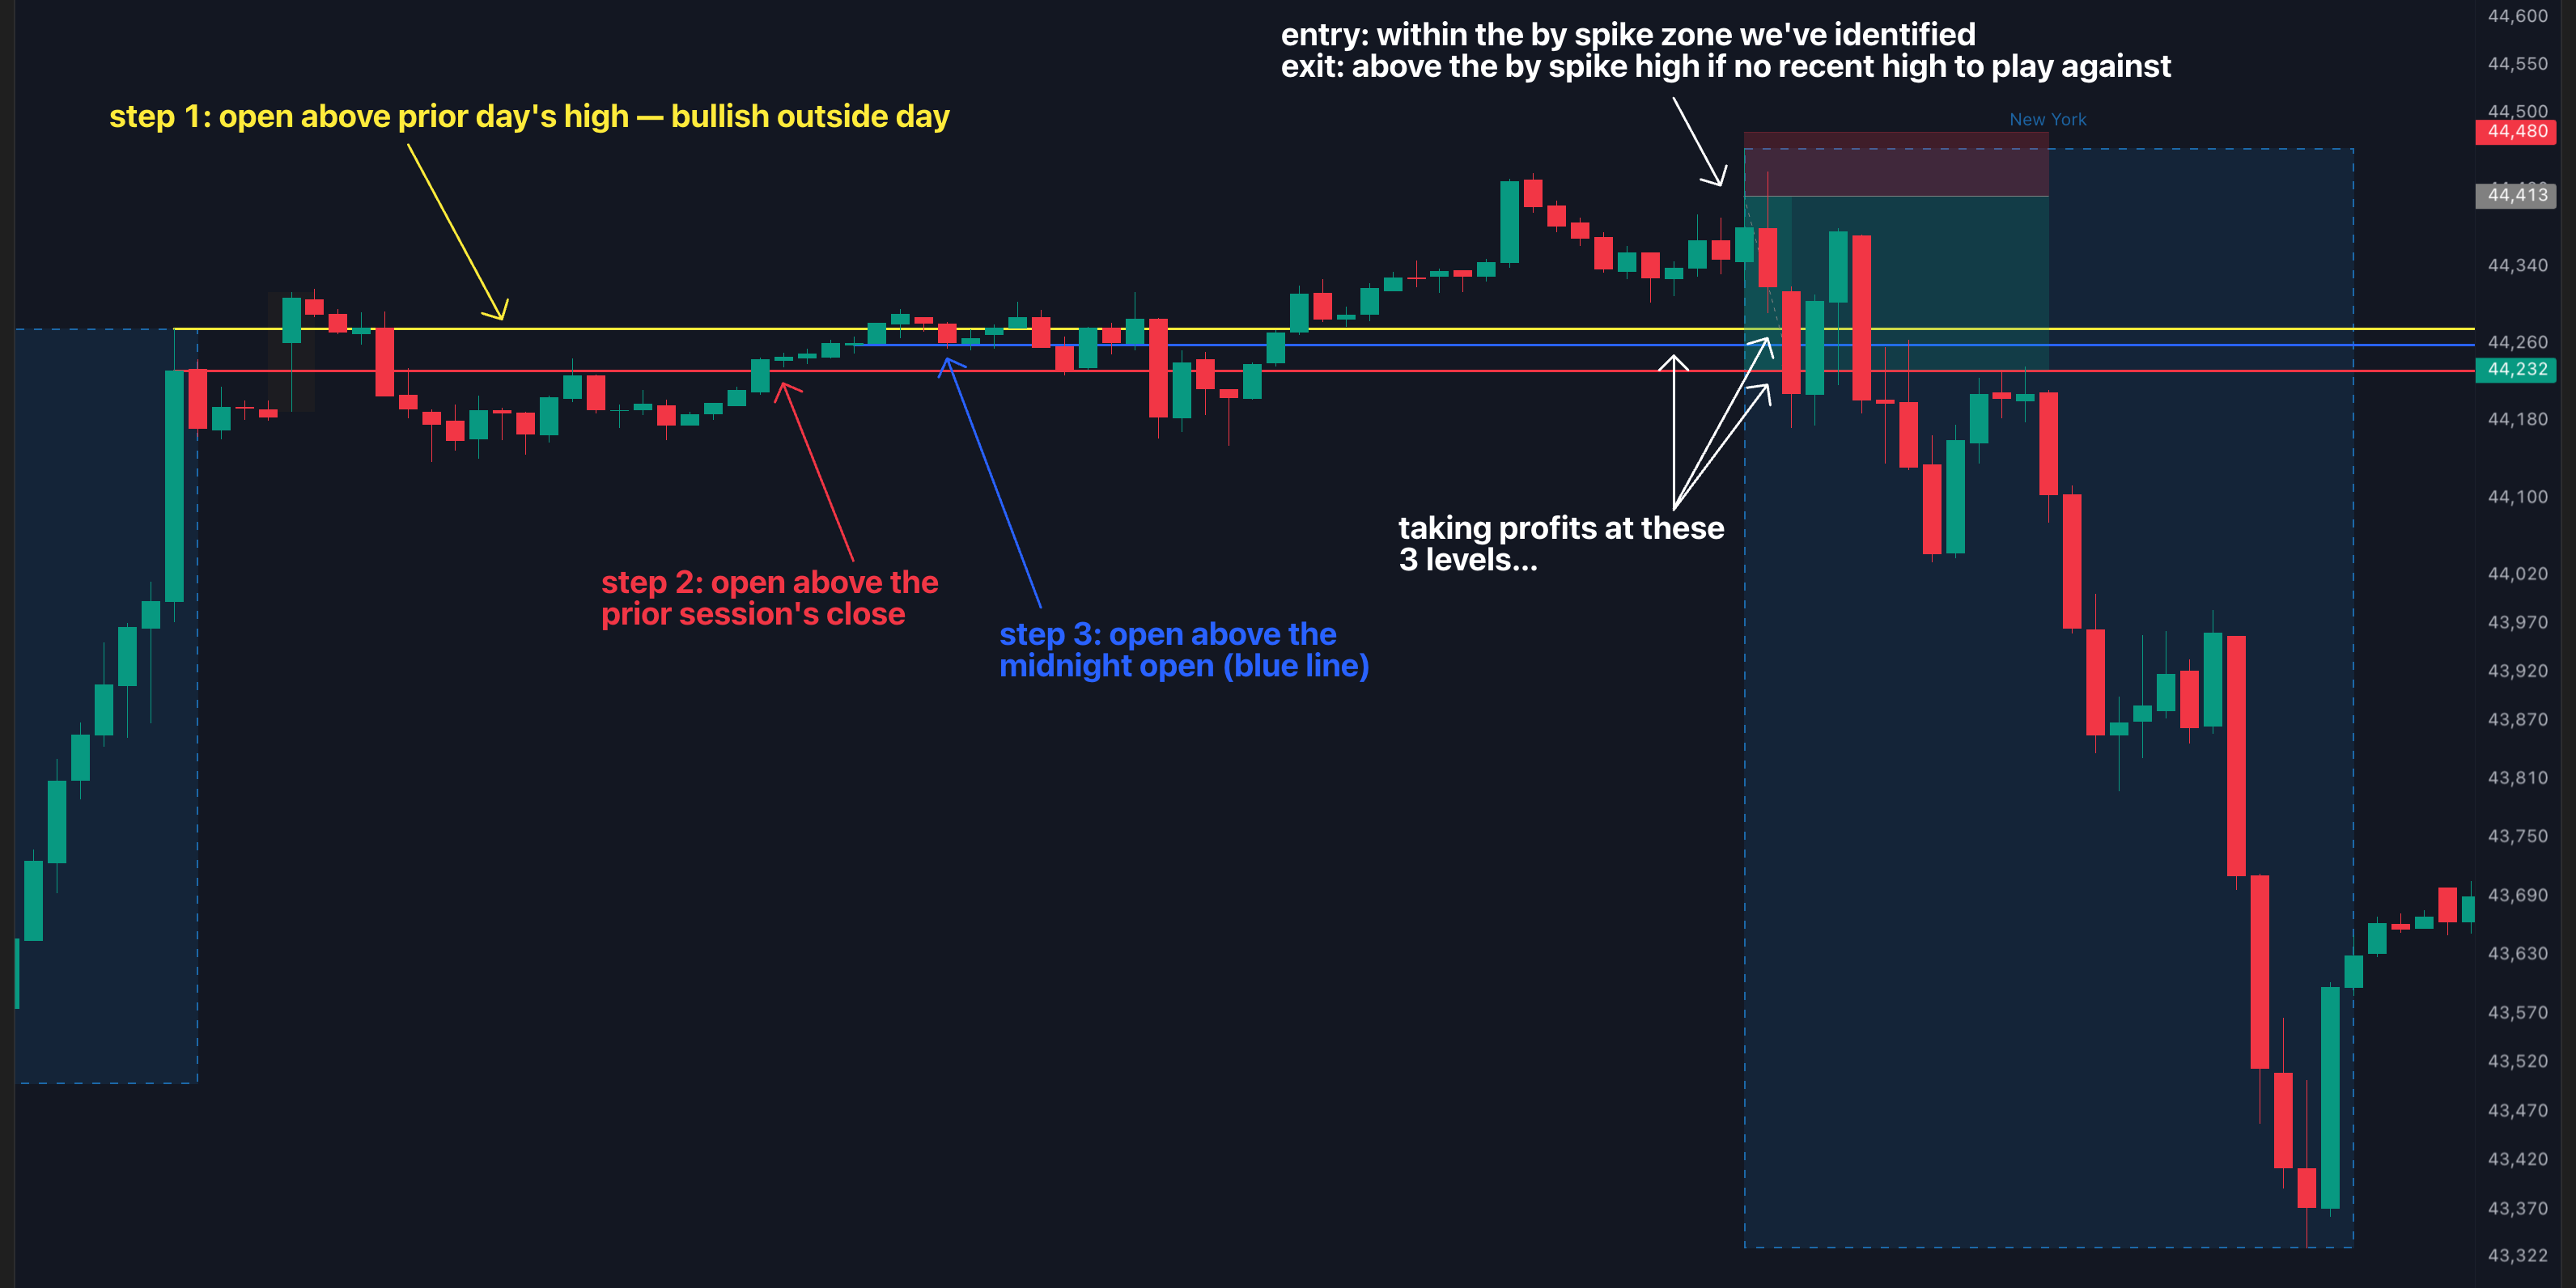
let's walk through an actual example from March 3, 2025 on YM (dow futures):
- step 1: YM opened as a bullish outside day - price opened above yesterday's high (yellow line). the outside days report told us there was a 67% chance price would reverse back down.
- step 2: YM also gapped up - opening above yesterday's close (red line). the gap fill report indicated a 68% chance the gap would fill during the session.
- step 3: YM opened above the ICT midnight open level (blue line). our data showed a 79% chance price would retrace back to test this level.
all three reports aligned to give a clear short bias on the open - even though we had a gap up, which many traders would see as bullish.
when to enter: using the "by spike" subreport
the biggest challenge with reversal trades is timing your entry. enter too early, and you might get stopped out by the initial momentum. enter too late, and you've missed a significant part of the move.
the most effective entry strategy for this setup is to combine the gap fill and outside day reports — but this time using the “by spike” subreports.
the gap fill and outside day by spike subreports measure the average upside continuation off the open — and is the green box you see above. they measure the drawdown you need to expect if you entered short right at the open before either the gap fills (gap fill report) or the outside day reverses.
these reports only consider days where the gap has filled — either to the prior day’s close (gap fill report) or the prior session’s high (outside days report), it ignores all days where the gap didn’t fill – only giving you the relevant data you need for the A+ reversal strategy I’ve covered today.
here’s what the gap fill by spike report stats are over the past 3 months on YM:
the stats above are telling us that when there's a gap up on YM, the average upside continuation off the open is $72.52. so this means if you were to enter short at the open, on average, you’d need to expect to be in $72.52 of drawdown before price reverses back to the gap fill target.
let’s now look at the stats for the outside day by spike subreport:
- outside day by spike: the average upside continuation before a bullish outside day reverses is $77.88
the stats above are telling us that when there's a bullish outside day on YM, the average upside continuation off the open is $77.88. so this means if you were to enter short at the open, on average, you’d need to expect to be in $77.88 of drawdown before price reverses back to the outside day target.
so what’s the main takeaway from using the two reports?
when there’s a gap up and a bullish outside day, on average you can expect an upside continuation between $70 and $80 points before price reverses back down towards either the prior session’s high or the prior session’s close. it may be a little more, it may be a little less, but by using these two reports, you can confidently identify a high probability zone where you can expect price to reverse downwards, using data — not your emotions.
here's the spike visualized on our March 3rd example (orange box):
two methods for entering the outside day gap fill reversal trade
method 1: entering at the open
if you enter short at the open, you need to make sure your stop is wide enough to account for the average spike. in our example, you probably would've been stopped out as YM traded past the average spike zone.
this method requires larger stops but ensures you catch the entire move if the reversal happens immediately.
method 2: waiting for the average spike to play out
the more conservative approach is to wait for the initial spike to exhaust itself. you'll miss some trades where the gap fills instantly, but you'll have a much better risk-to-reward ratio on the trades you do take.
your entry would be after price has moved beyond the average spike zone and starts to show reversal signs.
clear profit targets and stop placement
for the outside day gap fill reversal strategy, your targets would be:
- yesterday's high (from the outside day)
- the ICT midnight open level
- the gap fill level (yesterday's close)
you can take partial profits at each level, giving you multiple opportunities to lock in gains as the trade works in your direction.
for your stop, place it just above the high of the initial spike. if price continues higher after that initial surge, your reversal thesis is likely wrong.
the results: a 2R to 6R trade opportunity
in our March 3rd example, depending on where you entered, this outside day gap fill reversal strategy on YM resulted in over a 2R trade using the gap fill (red line) as your final profit target.
if you kept runners on throughout the rest of the session, this could've been a 6R+ trade - showing the power of combining multiple high-probability reports into a single strategy.
why this strategy works: the psychology behind it
why does this reversal setup work so consistently? it's because it exploits a fundamental market truth: the majority of traders get trapped in the wrong direction on these patterns.
when price gaps up and opens outside yesterday's range, most retail traders see it as bullish and go long. smart money knows that these levels are often exhaustion moves, setting up perfect reversal opportunities.
by trading against the crowd with data on your side, you position yourself with the professional traders who understand market structure.
how to implement this strategy in your trading
to start using the outside day gap fill reversal strategy:
- check your edgeful dashboard daily for setups where all three reports align
- look for bullish outside days that also gap up and open above the ICT midnight level
- decide if you'll enter at the open or wait for the initial spike to play out
- set your stops based on the average spike data
- take partial profits at each of the three target levels
remember, every report you use should have 60% or greater probabilities. all three reports in this reversal strategy have greater than 67% probabilities, giving you a powerful statistical edge.
wrapping up
the outside day gap fill reversal strategy is a perfect example of how combining multiple data-backed reports can create high-probability trade setups. instead of guessing or trading based on emotions, you're using actual market statistics to guide your decisions.
the next time you see a gap up or outside day, don't blindly follow the crowd. check the stats, measure the spike, and be ready to trade a data-backed reversal strategy with confidence.
remember - the market loves to fool the majority. when everyone is looking to go long on an outside day, the data shows you should be looking for shorts. that's the edge that data-driven trading gives you over emotional decision-making.