ultimate reversal trading strategy follow up: adding the weekly open report for more confidence
building on the a+ reversal strategy
last week, we covered the a+ reversal strategy using three different reports to identify high-probability short opportunities when the market gaps up. the strategy proved so powerful that the very next day, the market gave us the exact same setup - but in reverse.
in this post, we're going to enhance the a+ reversal strategy by adding a fourth powerful report - the weekly open - and show you how to apply this complete system to long trades when the market gaps down.
the enhanced a+ reversal strategy works with remarkable consistency in both directions, giving you a complete framework for capturing reversals regardless of market conditions.
quick recap: the three pillars of the original a+ reversal strategy
before we dive into the fourth component, let's quickly review the three key reports that form the foundation of the a+ reversal strategy:
- outside days report - identifies when price opens outside of yesterday's range
- gap fill report - measures how often gaps get filled to the prior session's close
- ICT opening retracement - tracks how often price retraces to the midnight open level
when these three conditions align, you have a powerful statistical edge suggesting a high-probability reversal.
the stats behind bearish outside days
while last week we focused on bullish outside days (when price opens above yesterday's high), today we're examining bearish outside days (when price opens below yesterday's low).
on YM over the last 3 months:
- when price opens below yesterday's low (bearish outside day), it reverses back up to touch yesterday's low 78% of the time
this is even stronger than the bullish outside day reversal probability of 67%!
most traders would see price opening below yesterday's low and immediately look for shorts. the data tells us the exact opposite - more than 75% of the time, price moves back up to touch yesterday's low.
with these stats in mind, yesterday's low becomes our first strong, data-backed target for a long entry on a bearish outside day.
the gap fill statistics for bearish reversals
the gap fill report gives us our second key level to target by measuring how often price retraces to the previous session's closing price.
on YM over the last 3 months:
- gaps down fill 64% of the time
this means when price gaps down, opening below yesterday's close, nearly two-thirds of the time it retraces back up to "fill the gap" by touching the prior session's close.
so now we know yesterday's close is our second data-backed target to take profits for our long trade idea.
the ICT open retracement for longs
regardless of your opinion on ICT methodology, the opening retracement concept provides objective, data-backed levels to trade from.
we’ll use it to check how often price during the NY session retraces back to touch the open of the midnight candle.
on YM over the last 3 months:
- when price opened above the midnight open, it retraced back down to touch that level 78% of the time
- when price opened below the midnight open, it retraced back up to touch that level 68% of the time
so when price opens below the midnight level, 68% of the time over the last 3 months it price moves back upwards to touch it — still very strong data, making the midnight open our third data-backed target.
introducing the fourth data-backed target: the weekly open report
now let's add the powerful fourth component that makes this strategy even stronger: the weekly open report.
the weekly open report measures how often price retraces back to touch the weekly open - the opening price on Sunday at 6PM ET. this is especially valuable for Monday trading sessions.
on YM over the last 6 months:
- when price opens below the weekly open, 83% of the time it retraces up to hit that level throughout the week
a very strong report showing that the Sunday 6PM ET price is definitely a level you want to have on your charts – we have a TradingView indicator that will automatically plot it for you every week, it’s called “edgeful – weekly open”. you can get access by inputting your TradingView username into the TV icon on the right side of your edgeful dash... so to recap, here are the 4 levels we’ve now identified:
- outside day report: target the prior session’s low
- gap fill report: target the prior session’s close
- ICT midnight open: target the midnight open
- weekly open: target the Sunday 6PM open price
let’s put it all together:
putting it all together: the complete a+ reversal long strategy
with all four reports, we now have a comprehensive system for identifying high-probability long setups:
- look for a bearish outside day - price opens below yesterday's low
- confirm a gap down - price opens below yesterday's close
- check if price opens below the ICT midnight open
- on Mondays, verify if price opens below the weekly open
when all four conditions align, you have an extremely high-probability long setup with four clear, data-backed target levels:
- yesterday's low (from the outside day report)
- yesterday's close (from the gap fill report)
- the midnight open level (from the ICT report)
- the weekly open (on Mondays)
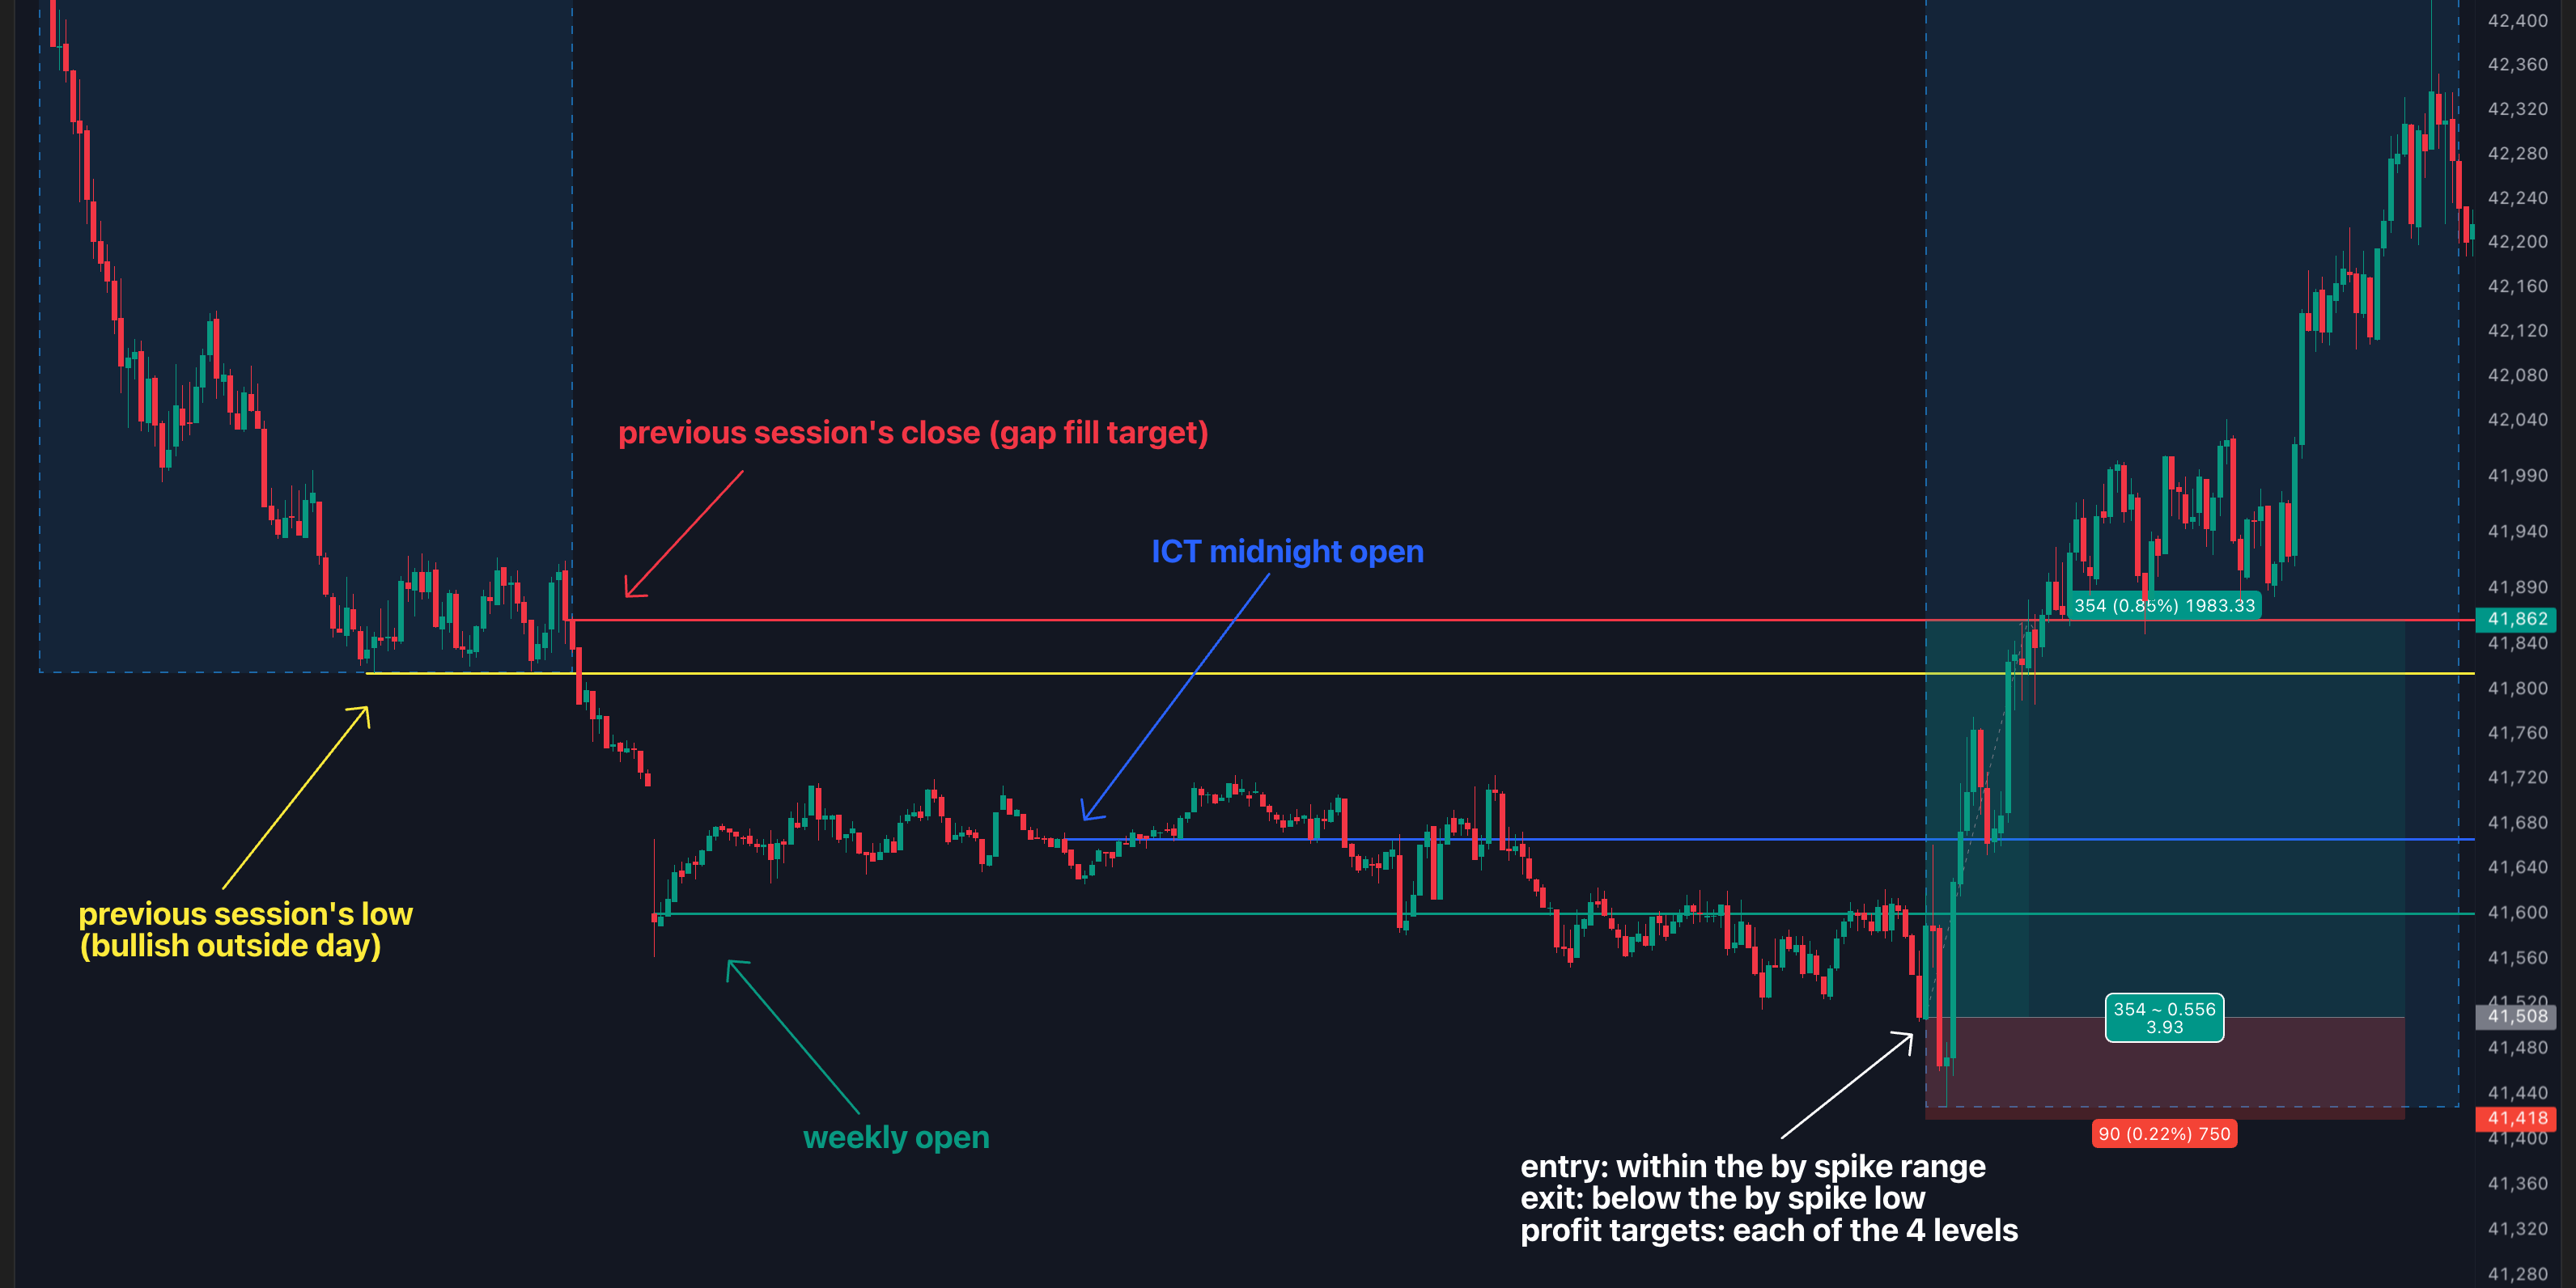
a real-world example: march 31, 2025 on YM
let's examine how this enhanced strategy played out on March 31, 2025 on YM:
the setup featured:
- a bearish outside day - price opened below yesterday's low (yellow line)
- a gap down - price opened below yesterday's close (red line)
- price opened below the ICT midnight open level (blue line)
- price opened below the weekly open (green line)
all four reports aligned to give a clear long bias on the open - even despite the gap down that would have many traders looking for shorts.
perfecting your entry with the "by spike" subreport
just like with the original a+ reversal strategy, we can use the "by spike" subreports to time our entries more precisely.
these subreports measure the average continuation in the direction of the gap before the reversal occurs. here's what they show for YM:
- when there's a gap down, the average downside continuation off the open is $79.5 before the reversal begins
- when there's a bearish outside day, the average downside continuation is $83 before price reverses up
in our March 31st example, the actual spike measured $79 - almost exactly matching the average from our gap fill by spike report.
two entry methods for the enhanced a+ reversal strategy
based on these statistics, you can use two different approaches to enter the trade:
method 1: entering at the open
if you enter long at the open, make sure your stop is wide enough to account for the average spike ($79-83 on YM). this approach ensures you catch the entire move if your analysis is correct, but requires accepting more risk.
method 2: waiting for the spike to complete
the more conservative approach is to wait for the initial downside spike to exhaust itself, then enter long once price shows signs of reversing. this provides a better risk-reward ratio but might miss some trades where the reversal happens immediately.
for either method, your targets would be:
- yesterday's low (from the outside day)
- the ICT midnight open level
- the gap fill level (yesterday's close)
- the weekly open (if applicable)
taking partial profits at each level allows you to lock in gains as the trade progresses.
the results: a massive 4R winner
in the March 31st example, this setup delivered a nearly 4R return by the time price touched the previous session's close - and that's without leaving runners on for potentially even larger gains. here's the image for you one more time:
while moves of this magnitude aren't typical, the enhanced a+ reversal strategy puts you in position to capitalize when they do occur.
why this strategy works: the psychology behind it
the enhanced a+ reversal strategy works because it identifies situations where most traders are caught on the wrong side of the market.
when price gaps down and opens below yesterday's low, the natural reaction for most traders is to look for shorts. but the data tells us that in these specific situations, a reversal back upward is far more likely.
by trading counter to the crowd and with statistical probabilities on your side, you position yourself to profit from the inevitable squeeze as those caught on the wrong side are forced to cover their positions.
implementing the enhanced a+ reversal strategy
to put this strategy into practice:
- check your edgeful dashboard daily for setups where all four reports align
- pay special attention to Mondays for weekly open opportunities
- decide if you'll enter at the open or wait for the spike to play out
- set stops below the spike low
- take partial profits at each of the four target levels
the best part is that this strategy now works in both directions:
- for bearish outside days with gaps down - look for longs
- for bullish outside days with gaps up - look for shorts
wrapping up: the power of data-driven reversals
the enhanced a+ reversal strategy exemplifies why data-driven trading is superior to emotional decision-making. when most traders are panicking and selling on a big gap down, the data shows you should be looking for longs.
remember these key statistics:
- bearish outside days reverse to yesterday's low 78% of the time
- gaps down fill 64% of the time
- price retraces to the midnight open 68% of the time when opening below it
- price touches the weekly open 83% of the time when opening below it on Mondays
by combining these four high-probability reports into a single strategy, you create an approach that gives you a significant edge over other market participants.
the next time you see a gap down with price opening below yesterday's low, don't automatically look for shorts. check if it meets the criteria for the enhanced a+ reversal strategy, and consider that the data may be pointing to a high-probability long opportunity instead.
want to access these reports and dozens of other data-driven tools to identify high-probability trading setups? explore the edgeful dashboard and start trading with data on your side.