stock market seasonality: why 'sell in may' is costing you money
one of the most expensive mistakes traders make? blindly following market "wisdom" without checking if the data actually supports it.
the "sell in May and go away" saying has cost traders millions by causing them to miss the market's strongest months. while everyone else is stepping away from the market in may, smart traders are positioning themselves for the year's biggest gains.
spoiler alert: the data tells a completely different story than what most people believe — and that's why studying stock market seasonality can be so beneficial for traders of all markets.
what market "wisdom" gets wrong about May to July
you've probably heard the saying "sell in May and go away" and then come back in September...
this saying suggests that returns during the summer months are typically worse than the rest of the year.
but here's the problem with blindly following these types of sayings: they're based on historical patterns that may no longer be relevant, and they don't account for specific markets or current conditions.
I was checking our seasonality report on ES futures, and the stock market seasonality data tells a completely different story:
over the past 3 years on ES:
- May averaged a 2.47% return
- June averaged a 0.97% return
- July averaged a 4.33% return
this means the strongest 3-month period throughout the entire year has actually been May to July!
if you were "selling in May and going away," you would have missed out on an average 7.77% return over just three months. that's not the kind of market you want to step away from if you're a long biased trader.
futures market seasonality shows consistent patterns
we can even look at a 5-year timeframe to see if this holds true:
over the past 5 years on ES:
- May averaged a 2.7% return
- June averaged a 1.04% return
- July averaged a 4.49% return
again, May-July comes in as the strongest 3-month period of the year, even over a longer timeframe. this consistency in futures market seasonality patterns gives us confidence that this isn't just a recent anomaly.
the Santa Claus Rally reality check
the "santa claus rally" typically refers to the December timeframe — expecting a big run in either the futures market or stocks themselves leading into December 25th. but what does the stock market seasonality data actually say?
December doesn't necessarily show up as powerful as you may think:
December's average return over the last 3 years is negative!
this is another example of market "wisdom" that doesn't fully align with the stats... and is that much more reason for you to challenge everything you hear, and back it up with data.
what the seasonality report actually shows
before i dive deeper, let's clarify what stock market seasonality analysis actually measures.
the seasonality report looks at the average performance of each month going back either 3 or 5 years. it's measuring from the close of the previous month to the close of the current month, giving you a clear picture of how each month has performed historically.
this is crucial because it helps you establish a broader bias for your trading. if you know that a particular month has historically been bullish or bearish, you can adjust your trading approach accordingly.
but here's the key thing to understand — stock market seasonality isn't meant to be used on its own. it's most powerful when combined with other data points and current market conditions.
how to apply seasonality data to your trading
here's how I use stock market seasonality data in my own trading:
- check the seasonality report at the start of each month
- identify if the upcoming month has historically been bullish or bearish
- use this as a backdrop for my trades, not as the sole reason to enter or exit
- look for confluence with other reports and current price action
- if i ever hear a new saying about how the market generally acts, check the seasonality report instantly
for example, if I see that July has historically been a strong month for ES (which it has), and I'm seeing a shift in the market where breakouts of the initial balance are continuing higher, I'm more likely to trade these types of moves with greater conviction.
practical stock market seasonality applications
another way to use stock market seasonality would be if we start July on a down week and you start to see signs of a reversal (you can use our consecutive bars report in this idea as well) — you can position yourself for a move back to the upside knowing how strong July normally is.
this doesn't mean every July will be bullish, but it gives me more confidence in my bullish bias if other factors align.
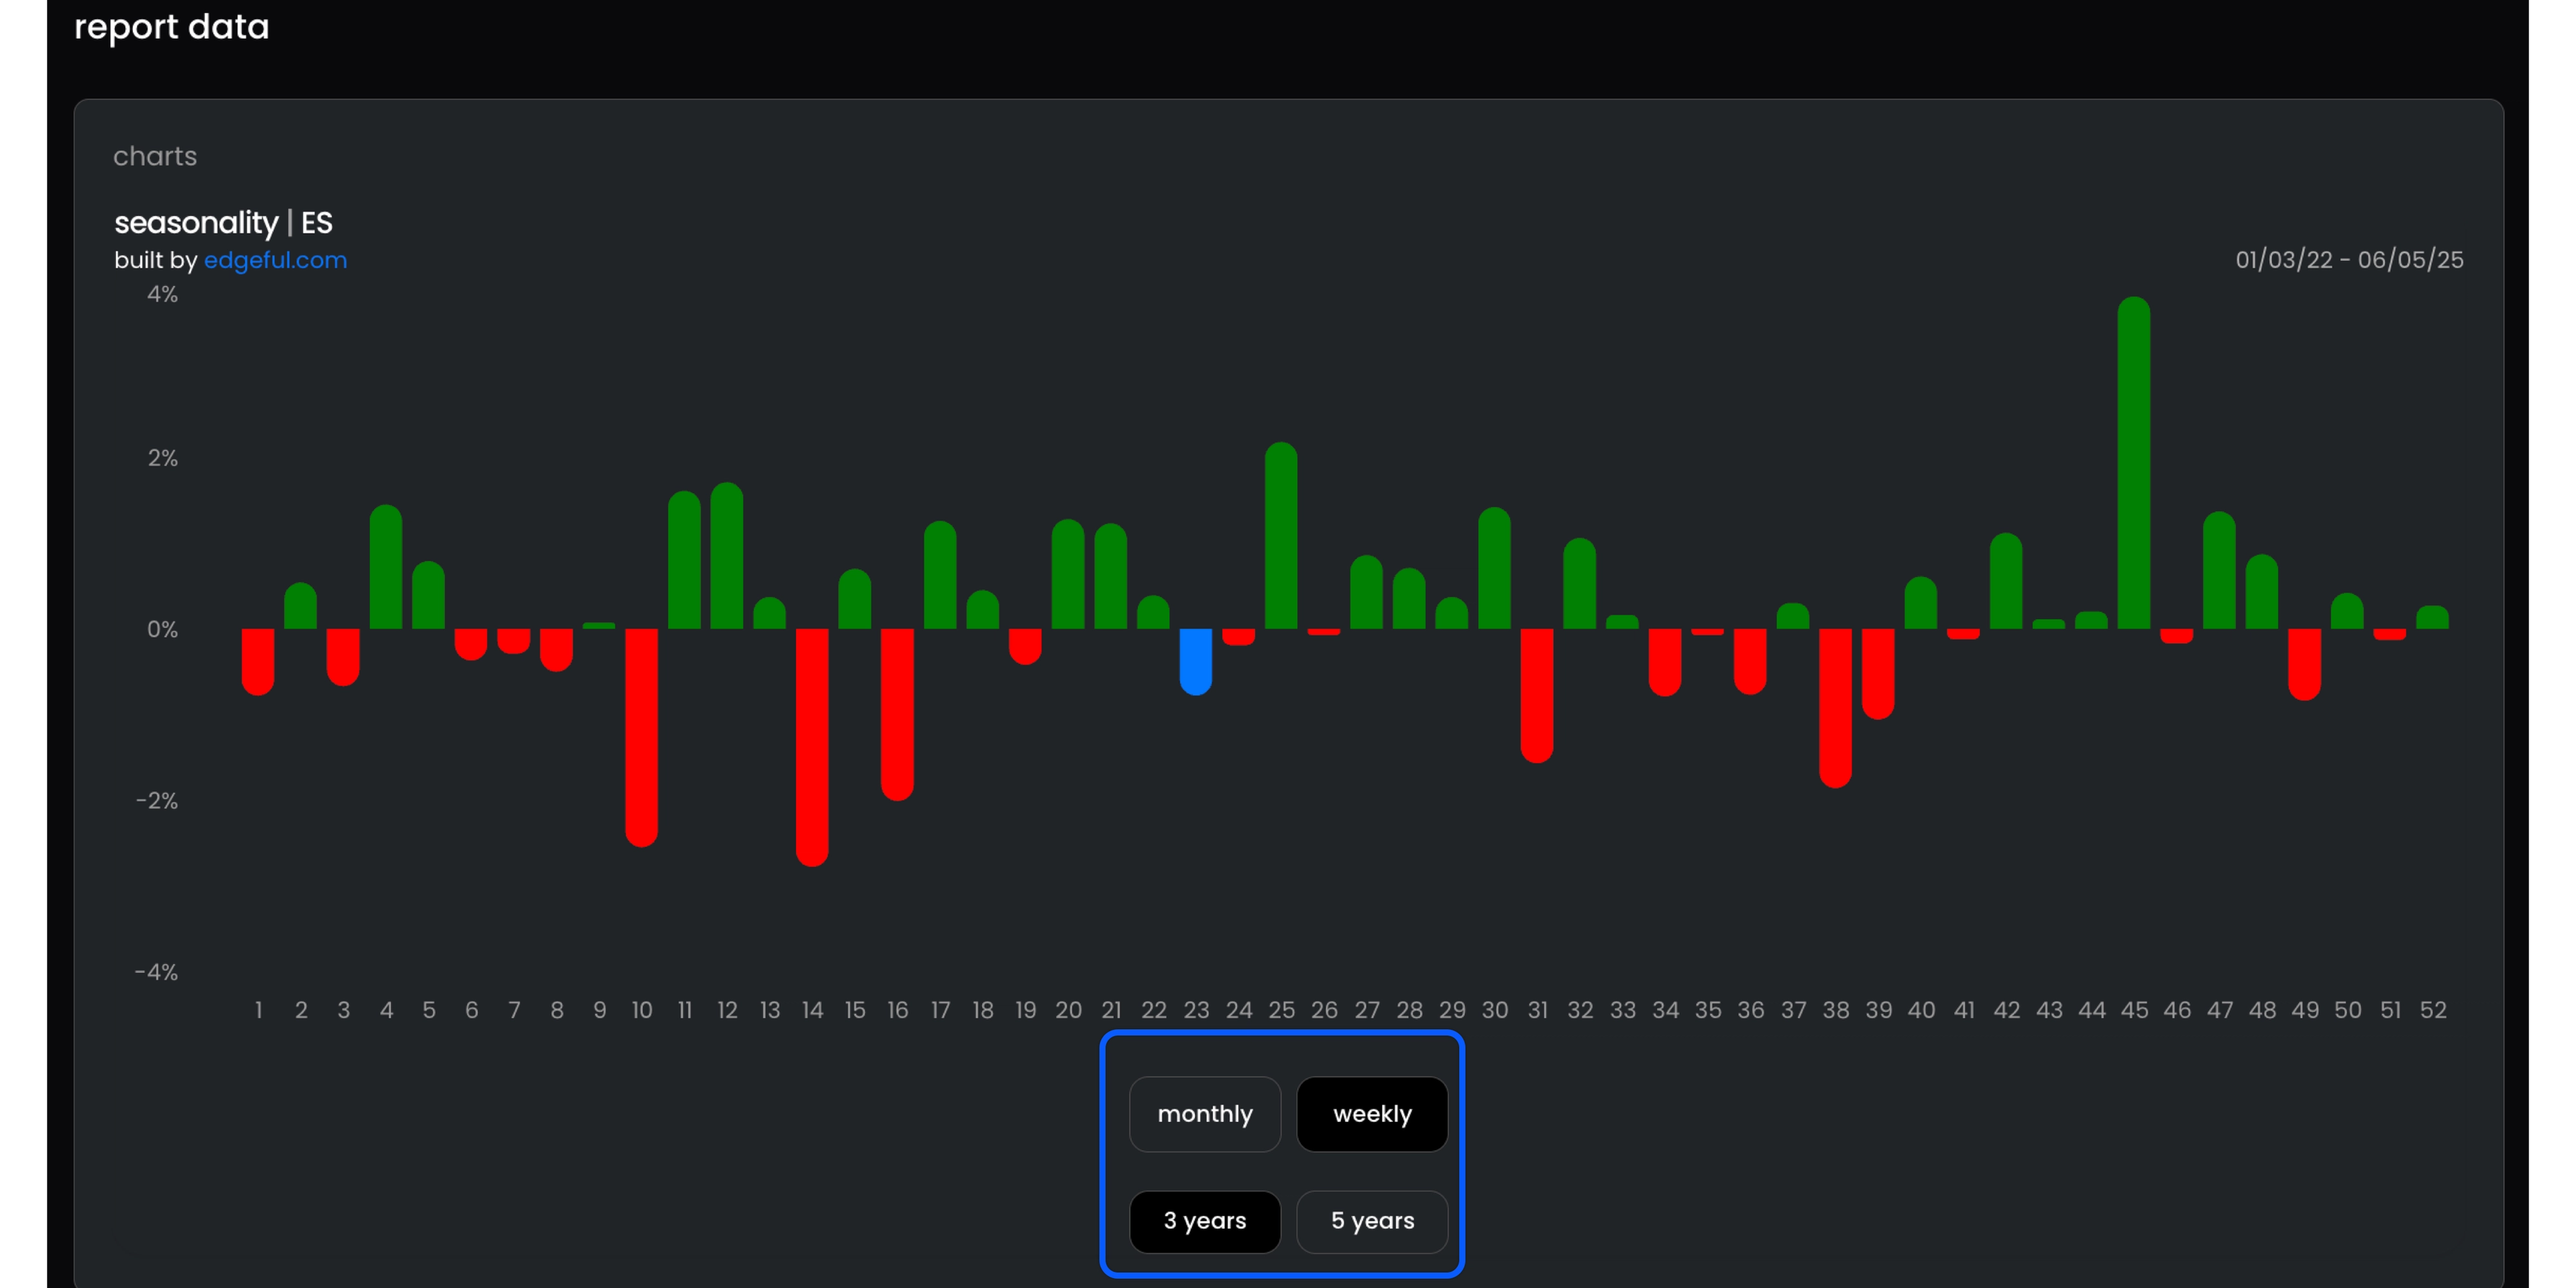
you can also take the seasonality report to the next level by checking the "weekly" view. this allows you to get a gauge for the potential action on a more granular level within your futures market seasonality analysis.
Show Image alt text: futures market seasonality weekly breakdown showing granular data for monthly analysis
combining seasonality with other edgeful reports
the real power comes when you combine stock market seasonality with our other reports. here are a couple of different reports/tools you can look for to combine with this one to get a broad bias for the session:
opening candle continuation report — looks at how likely we are to close green if the first hour is green
the what's in play screener — get an instant look at how different report biases are forming across multiple tickers
look for our ultimate bullish setup to show up more consistently during historically strong months
when futures market seasonality suggests caution
one more important point: stock market seasonality can also tell you when to be more cautious. for example, September has shown negative returns on many indices over the past 5 years.
this doesn't mean you should only go short in September, but it might mean you should be more selective with your long trades or take smaller position sizes especially if you start getting negative feedback on your long trades.
real-world application considerations
while futures market seasonality data is powerful, there are important caveats to keep in mind:
- stock market seasonality is based on averages, not guarantees
- current market conditions can override historical patterns
- specific catalysts (like fed meetings or major geopolitical events) can disrupt seasonality
- different tickers have different seasonal patterns (what works for ES might not work for NQ)
this is why I always recommend using stock market seasonality analysis as one input into your trading, not as your entire strategy.
best practices for stock market seasonality
best use for the seasonality report:
- check seasonality across multiple timeframes (3-year and 5-year)
- compare different tickers to see if the pattern holds across the market
- always confirm with current price action before making trading decisions
- use other edgeful reports to build conviction in your trades
the main takeaway here is clear: don't blindly follow market sayings or conventional wisdom. check the data yourself — it only takes a few seconds in your edgeful dashboard — and make informed decisions based on what the numbers are actually telling you, not what people are saying.
wrapping up
let's do a quick recap of what we covered today:
- the "sell in May" saying is completely wrong based on actual data on ES
- May-July has been the strongest 3-month period over both 3 and 5-year timeframes
- the seasonality report helps you establish a broader market bias
- combining stock market seasonality with other reports creates maximum confidence
- always verify market "wisdom" with actual data before trading on it
I can't stress this enough — one of the biggest advantages you can have in this market is simply verifying what everyone else assumes to be true. while the crowd is selling in may based on an old saying, you can be looking at the actual stock market seasonality data and positioning yourself accordingly.
ready to stop following market myths and start trading with data?
join thousands of traders who get our free stay sharp newsletter every Saturday morning. we break down the data behind popular trading strategies and show you what actually works — not what people think works.
don't let market myths cost you money. the data is clear — and it's time you started using it to your advantage.