engulfing bars: how to set data-driven profit targets (not hope)
what are engulfing bars and why do most traders fail to trade them?
engulfing bars are one of the most recognizable reversal patterns in trading, yet 99% of traders get them completely wrong. everyone knows how to spot them, but almost no one knows where to actually take profits based on real data.
here's what happens all the time: traders spot a perfect engulfing bar and immediately let their emotions get the best of them. they either hold for massive targets and give back everything, or they get scared after a few points of profit and exit way too early.
both approaches are based on emotions and hope — not data.
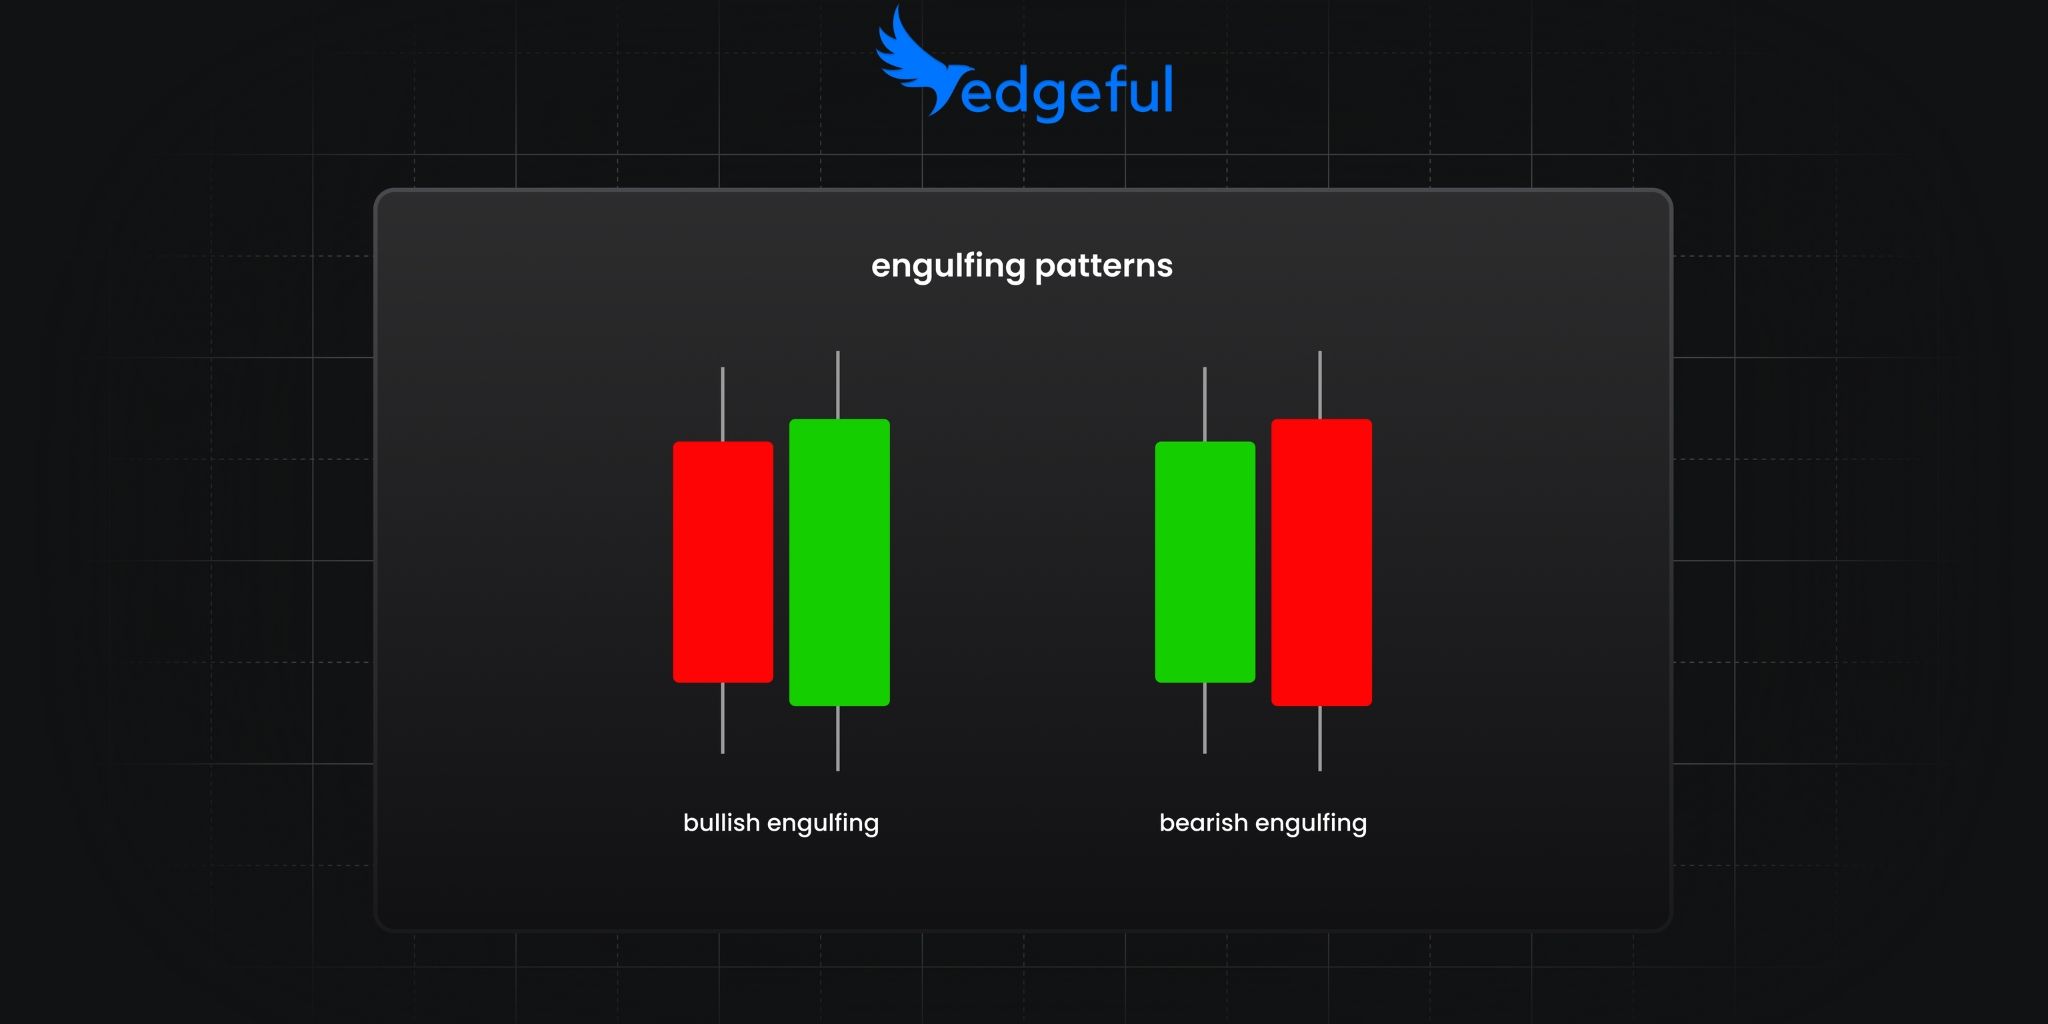
understanding bullish engulfing bars
a bullish engulfing bar occurs when:
- the current candle opens at or below the previous candle's close
- closes above the previous candle's open
- is green (close > open)
- the previous candle is red
understanding bearish engulfing bars
a bearish engulfing bar occurs when:
- the current candle opens at or above the previous candle's close
- closes below the previous candle's open
- is red (close < open)
- the previous candle is green
the engulfing risk-reward data that changes everything
instead of guessing where to take profits on engulfing bars, you can use concrete data to make these decisions. the engulfing by risk-reward report tracks each engulfing bar independently throughout the session and calculates what R multiple price hits.
before we get to the stats, here's how the setup works
for bullish engulfing:
- enter long at the close of the bar
- place your stop loss at the low of the bar
- check the stats to see how often price hits 0.5R, 1R, 1.5R, 2R, 2.5R, and 3R before hitting your stop
for bearish engulfing bars:
- enter short at the close of the bar
- place your stop loss at the high of the bar
- measure the same RR targets
if price hits 2R and then reverses, it counts 0.5R through 2R as successful targets — giving you a clear picture of what's actually achievable with engulfing bar patterns.
real data from ES and NQ (last 6 months)
here are the actual statistics for engulfing bars over the last 6 months using 30-minute patterns:
ES statistics:
- bullish patterns hit 0.5R: 64.89% of the time
- bullish patterns hit 1.0R: 37.4% of the time
- bearish patterns hit 0.5R: 57.3% of the time
- bearish patterns hit 1.0R: 41.8% of the time
NQ statistics:
- bullish pattners hit 0.5R: 64.13% of the time
- bullish patterns hit 1.0R: 32.61% of the time
- bearish patterns hit 0.5R: 53.27% of the time
- bearish patterns hit 1.0R: 35.51% of the time
key takeaways from the engulfing by RR data
these numbers reveal several critical insights:
- bullish patterns are more reliable than bearish ones on both ES and NQ
- the probability drops dramatically from 0.5R to 1.0R targets — on ES, bullish engulfing bars drop from 64.89% to 37.4% (a 27% drop!)
- targeting 0.5R gives you better win rates than holding for 1R or higher
if you're always holding these setups for 1R targets, you may be giving back more profits than necessary because the data shows 0.5R targets work much more consistently.
why 30-minute engulfing bars work best
you can find these reversal patterns on 5-minute, 15-minute, or 30-minute charts, but 30-minute timeframes provide the cleanest signals for several reasons:
easier pattern identification
on a 5-minute chart, you might see 7+ of these setups in a single day, making it overwhelming to track and trade them all. 30-minute timeframes create much cleaner signals to identify.
better follow-through
30-minute patterns represent more significant market structure, so when they work, they tend to work better with less noise and whipsaws.
reduced false signals
you avoid getting caught in intraday volatility that can make shorter timeframe patterns unreliable.
how to trade engulfing bars with confidence
here's the step-by-step process for trading engulfing bars based on data:
step 1: identify 30-minute patterns
we have our very own TradingView indicator that allows you to spot the engulfing bar setup directly on your chart — just search it in the TV indciator library under "edgeful — engulfing bars".
you'll then see plenty of setups like this:
step 2: enter at the close, stop at high/low
enter long on bullish patterns at the candle close, with your stop at the low. reverse this process for bearish setups.
step 3: set profit targets based on data
this is where the statistics become crucial:
- for higher win rates (64% on ES bullish): target 0.5R
- for bigger individual wins (37% on ES bullish): target 1.0R
- avoid targeting beyond 1R — very unlikely price reaches these levels consistently.
step 4: focus on bullish engulfing bars
the data clearly shows bullish patterns outperform bearish ones across both ES and NQ. if you had to choose one direction, focus on the long trades.
combining engulfing bars with other trading signals
engulfing bars work best when combined with other confluence factors:
market structure analysis
if price is breaking out of key levels and you get an engulfing bar in the direction of the breakout, that's additional confirmation for your trade.
session bias
if the first hour of trading — the opening candle continuation pattern — is bullish and you see a bullish engulfing bar, you have confluence for the directional bias.
gap analysis
if there's an unfilled gap in the direction of your pattern, you have another logical target to work toward.
the key is building conviction through multiple data points, not just trading every engulfing bar you see.
common engulfing bar trading mistakes
mistake 1: holding for unrealistic targets
many traders see a perfect reversal pattern and immediately dream about 3R winners, ignoring the data that shows most setups don't follow through that far.
mistake 2: not using proper risk management
failing to place stops at the high or low of the candle removes the logical invalidation point for the pattern.
mistake 3: trading every pattern
not all setups are created equal. focus on patterns that align with the broader market structure and session bias.
mistake 4: ignoring the timeframe
using 5-minute engulfing bars often leads to overtrading and getting caught in market noise.
what is an engulfing bar vs other reversal patterns?
traders often ask "what is an engulfing bar" and how it differs from other reversal patterns or strategies. unlike inside bars or doji patterns, engulfing bars show decisive rejection of the previous candle's range.
is an inside bar the same as an engulfing bar?
no, an inside bar is the opposite of an engulfing pattern. while an engulfing setup completely engulfs the previous candle, an inside bar forms completely within the previous candle's range, suggesting consolidation rather than reversal.
an engulfing candlestick completely encompasses the previous candle's body, suggesting strong momentum in the new direction. this makes them more reliable than smaller reversal patterns.
however, not every pattern leads to sustained moves, which is why the risk-reward data becomes so valuable for setting realistic expectations.
conclusion: trade engulfing bars with data, not hope
the difference between profitable traders and everyone else isn't that they have some secret pattern or setup. it's that they use data to make decisions instead of hoping and guessing.
next time you see a perfect engulfing bar, don't immediately start dreaming about massive winners. check the data, set realistic targets based on what actually happens, and trade with confidence instead of hope.
remember — the market doesn't care what you think should happen. it only cares what actually happens. use the data to align your expectations with reality when trading engulfing bars.