how to build a trading dashboard with the edgeful API (no code required)
most traders blow funded or live accounts the same way. a couple of good weeks. then one bad morning ruins all the progress. then another bad trade hits. then the account is done.
the hard part is the setups don't always feel that bad. on a different day, they could've worked. but the problem is you don't know what those "different day" criteria are. what you're doing isn't backed by anything historical.
and most of the work of filtering bad setups out is the kind of work an AI agent or LLM can do for you in seconds now.
that's the truth of where the trading space is going. if you're not leveraging claude (or some form of AI) in your trading workflow, you're going to fall behind the traders who are. it's the difference between staring at a screen for an hour trying to remember which setups have an edge and asking one question and getting the answer back.
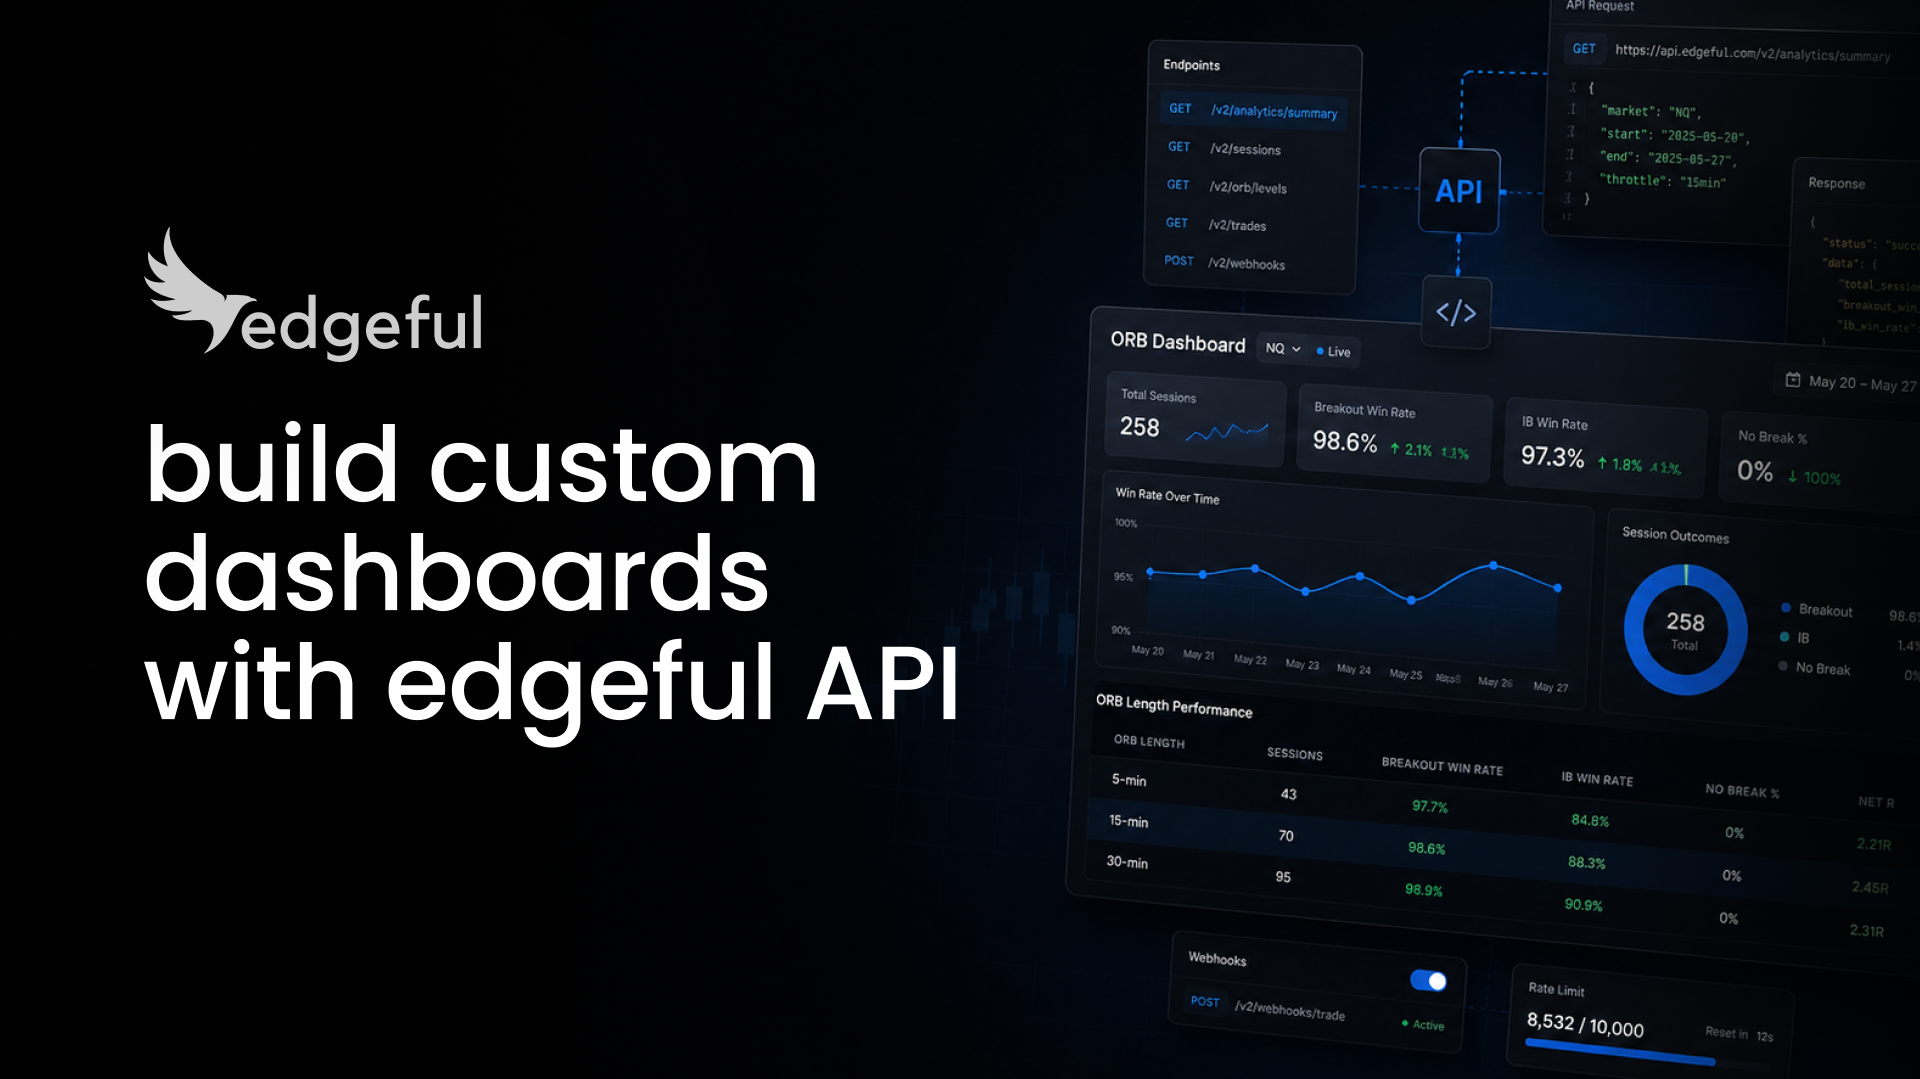
a custom trading dashboard built on the edgeful API is one way to put that filtering work on autopilot. it's not a chart layout. it's a custom view of computed probability data, sized to your tickers, your reports, and your decision rules. it lives wherever you actually read things: Discord, Slack, email, Notion, or a private webpage you host yourself.
this guide walks through a real scan we ran this week across ES, NQ, CL, and GC. one prompt, four markets, four reports. by the end you'll see what a working trading dashboard looks like in practice, and how to deploy your own version.
table of contents
- what you need before you start
- the scan: one prompt, four markets, every 70%+ setup
- what the scan returned
- PDH and PDL as bias markers across futures
- the target-vs-hold split: where holding past the level actually works
- the trading rule that comes out of the scan
- how to deploy this as your own dashboard
- key takeaways
what you need before you start
- an edgeful API key (included on essential (restricted access), pro and all access plans, generate at edgeful.com/api-dashboard)
- an AI agent that can hit a URL: claude, cursor, chatgpt, or similar
- a place for the output to land (Discord, Slack, email, Notion, or a custom page)
- 10–15 minutes to spin up the first version
if you're brand new to the API, the edgeful API quickstart covers the setup and the first call before you tackle a full dashboard build. all you have to do is give your agent that link, and it’ll build the infrastructure in minutes.
the scan: one prompt, four markets, every 70%+ setup
here's the actual prompt we ran this week against the edgeful API:
scan ES, NQ, CL, and GC over the last 12 months across gap fill, IB, ORB, and previous day's range. return every setup with a 70%+ historical probability. include sample sizes.
four tickers, four reports, sixteen combinations. one prompt. claude pulled every relevant endpoint, computed the probabilities, and returned a ranked list in under a minute.
that's the build. that's what a trading dashboard with the edgeful API actually does when you stop thinking of it as a chart layout and start thinking of it as a scanner that watches your edges for you.
what the scan returned
eleven setups cleared the 70% bar across the four tickers. they came from two reports.
the previous day's range report checks if price hits the previous day's high or low during the session, then whether the session closed green or red. most traders use this level wrong. for the long version of why, see why most traders get previous day's range levels completely wrong.
the initial balance (IB) report checks whether price single-breaks (one side only), double-breaks (both sides), or doesn't break the first hour's range at all.
those are different questions, so they trade differently. the rest of this guide focuses on the previous day's range setups, because that's the one that maps cleanest to a daily decision rule.
two reports didn't clear the 70% bar at all. gap fill came back at 44–62% across the four tickers. the 15-minute ORB single break came back at 36–50%. neither cleared on any market. that's useful information on its own. it's a filter that says don't trade either as a standalone edge right now without something else stacked on top of it.
PDH and PDL as bias markers across futures
the first lesson from the scan is also the most useful one. the previous day's high and previous day's low are directional bias markers for the session across every major futures market.
when one of them breaks, the rest of the session tends to follow that direction into the close.
over the last 12 months in the NY session:
- on ES, when price broke the previous day's high, the session closed green 78% of the time (126 of 162 sessions)
- on NQ, the same trigger closed green 82% of the time (128 of 156)
- on CL, 88% (120 of 137)
- on GC, 87% (125 of 144)
the rule is straightforward. PDH breaks → lean bullish for the close. PDL breaks → lean bearish.
so far this looks like a clean signal across all four markets. that's the part most traders stop at, and it's also where most prop firm accounts get cooked. for the broader risk frame around prop firm survival, futures risk management: 9 rules that prevent blown accounts is worth reading alongside this one.
the target-vs-hold split: where holding past the level actually works
"session closes green" can mean two different things. it can mean price ran through PDH and stayed above it for the close. or it can mean price tagged PDH, drifted back below it, and still closed green underneath.
those are different outcomes. one is a continuation trade you can hold. the other is a level tag and a fade, which means you should take profit at the level and step aside. (this is the same distinction we cover in continuation vs reversal: how to know which edgeful reports to use, applied at the level break.)
so we re-ran the scan with a tighter filter. the session has to close above the broken PDH (true continuation), not just close green. here's what fell out:
on GC, the gap is the smallest. when PDH breaks, GC closes above the high 72% of the time. that's a setup you can hold past the level into the close.
on CL, same idea. 67% true continuation rate on PDH breaks.
NQ and ES drop further. when PDH breaks on ES, the session closes green 78% of the time, but only 61% of those closes are above PDH. roughly one in five sessions hits the level and drifts back below. that's the session that turns a winning trade into a losing one when you hold for a true breakout that doesn't come. the ES vs NQ comparison covers the broader behavioral differences between the two index futures that show up here.
the bearish direction (PDL breaks → close red, close below PDL) follows the same pattern. CL and GC hold up best. ES and NQ are target trades, not hold trades.
the trading rule that comes out of the scan
the entire scan compresses into one rule:
- PDH or PDL break is a directional bias signal across every major futures market
- on GC and CL, that bias is worth holding past the level into the close
- on ES and NQ, take the target (a green or red close) and step aside
that one rule cuts most of the "I gave it all back" sessions on ES and NQ. it's also the kind of filter you'd never derive from chart-watching alone. it shows up when you put the markets side by side and let the math run against an actual 12-month sample. the broader strategy of stacking reports for bigger, higher-conviction moves is covered in holding for bigger moves.
real performance from any rule still requires customization, time, and effort. anything under 70% on the target side isn't strong enough to trade alone. anything where the continuation rate is below 65% should be a target-and-out setup, not a hold. the rule above is the floor for a prop firm account where one bad hold can end the run.
if you want the visual companion on a chart, the previous day's range indicator for TradingView plots PDH and PDL automatically so you can see the bias trigger fire in real time alongside the dashboard data.
how to deploy this as your own dashboard
the scan above isn't a one-time exercise. it's a dashboard pattern you can run every morning.
once you have an edgeful API key and an AI agent, the workflow looks like this:
- write the prompt once, scoped to the tickers and reports you trade
- tell your AI agent to run it on a schedule (every weekday at 8:30 AM ET is a common starting point)
- format the output to land somewhere you actually read (Discord channel, email, Notion page)
- add a rolling 12-month window so the leaderboard updates as the data shifts
what changes day to day is small. what changes month to month is what's worth watching. a setup that ran 72% over the last 12 months and drops to 64% over the trailing 90 days is the early signal that the edge is decaying. that's the kind of thing a static dashboard can't tell you and a scheduled scan can.
if you're comparing edgeful's API against raw market data providers before you commit, the polygon vs databento vs edgeful futures data api comparison walks through the tradeoffs in detail.
key takeaways
- a trading dashboard with the edgeful API is not a chart layout. it's a custom view of computed probability data, sized to your tickers and your decision rules.
- one prompt against the API can scan four markets across four reports and return every setup with 70%+ historical probability, with sample sizes, in under a minute.
- across ES, NQ, CL, and GC over the last 12 months, the previous day's range report produced the strongest signals. gap fill and 15-min ORB single break did not clear 70% on any ticker.
- PDH and PDL break is a directional bias signal across all four markets, at 76–88% close-in-direction rates.
- only GC and CL extend beyond the broken level at meaningful rates (67–72%). on ES and NQ, take the target and step aside.
- results from any dashboard build still require customization, time, and effort. the API removes the data step; the trading judgment is still on you.
risk disclaimer
historical data does not guarantee future returns. the probability numbers in this guide are based on a specific 12-month window of NY session data across ES, NQ, CL, and GC and should be re-verified against current windows before use. statistical edges decay over time, market environment shifts, and live trading still requires risk management beyond pulling data into a dashboard.
FAQs