best time to trade futures: a session-by-session guide backed by real data
the best time to trade futures depends on the session, the ticker, and the type of setup you're looking for. finding the best time to trade futures isn't about picking a random hour — it's about understanding futures market hours and knowing which windows actually produce consistent setups.
most traders default to the NY session because that's when they're awake — not because they've looked at the data. but when you actually compare the average range, volume, and which setups work across different trading sessions... the picture gets a lot more specific. and that specificity is what separates a trader with a plan from one who's just "on" whenever the market is open.
in this guide, we're going to break down the 3 major futures trading sessions using real data — what each one offers, which edgeful reports are most useful in each, and how to figure out the best time to trade futures for your specific setup and schedule.
table of contents
- what makes certain times the best time to trade futures
- the 3 major futures trading sessions explained
- what the data shows: average range by session
- which edgeful reports work best in each session
- the best times to trade within the NY session
- why day of week matters as much as time of day
- how to find your best trading window
- common mistakes traders make with market hours
- key takeaways
what makes certain times the best time to trade futures
futures market hours span nearly 24 hours a day, 5 days a week. but that doesn't mean every hour is created equal.
three things determine whether a given time window is worth your attention:
- volume — how many contracts are being traded. higher volume generally means tighter spreads and cleaner fills
- volatility — how much price is actually moving. if the range is tight, there's not much to capture
- liquidity — how easily you can get in and out without slippage
here's the thing most traders miss though — more volume doesn't automatically mean "best time to trade futures." what matters is whether the price action during that window creates setups you can actually use. a high-volume session where price chops back and forth in a 5-point range on ES isn't more useful than a lower-volume session that trends cleanly in one direction.
the best time to trade futures is when the data shows consistent, repeatable patterns during a specific window. that's what makes session analysis so valuable — you're not guessing. you're looking at how each session has performed historically. and if you're specifically looking for the best time to day trade futures, that data narrows the window even further.
if you're not sure about the difference between electronic trading hours and regular trading hours — two key concepts for understanding futures market hours — we break that down in our ETH vs RTH guide.
the 3 major futures trading sessions — and how futures market hours break down
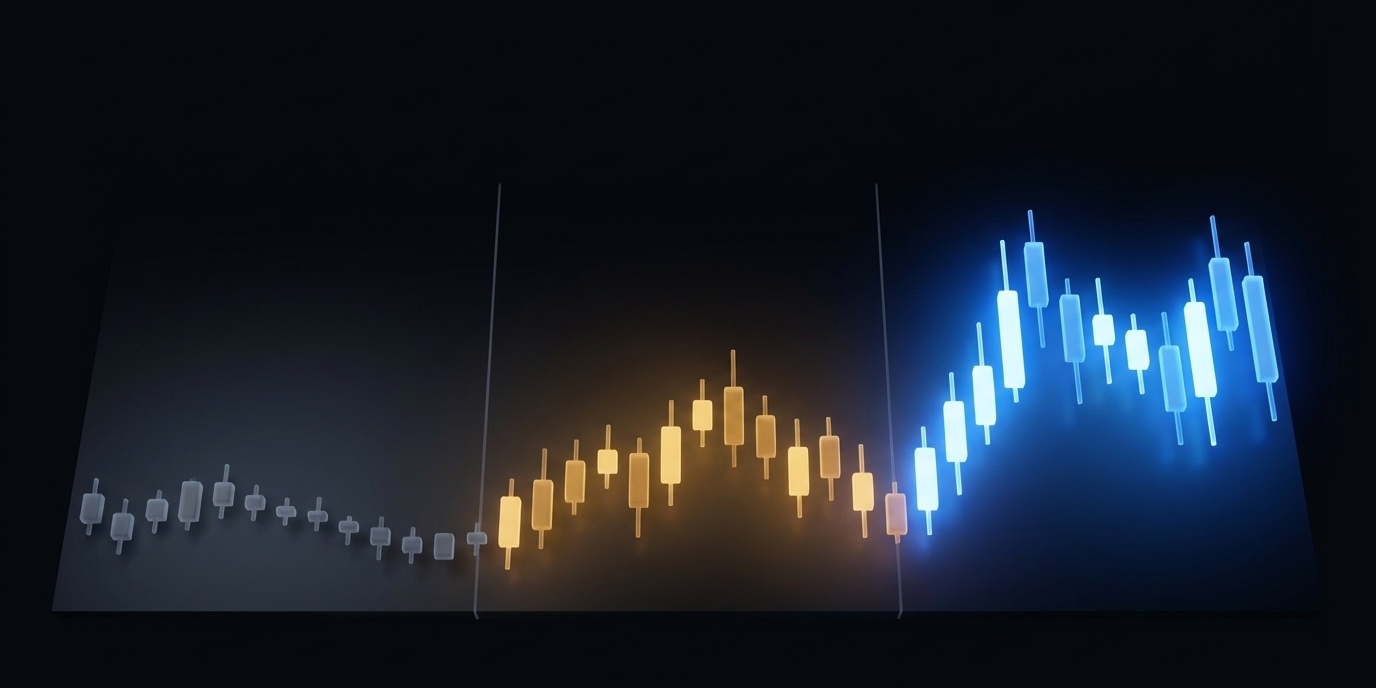
understanding the best time to trade futures starts with knowing the 3 primary trading sessions. each one has a distinct personality — different volume profiles, different types of setups, and different levels of activity.
asia session (7:00 PM – 4:00 AM ET)
the Asia session kicks off when the CME reopens on Sunday evening (or each weeknight after the daily maintenance break). this is the quietest session for US-based futures.
here's what to expect:
- low volume and low volatility compared to the other two sessions
- price tends to be range-bound. big directional moves are rare
- this session is mostly about overnight positioning and institutional order flow outside of US hours
- GC (gold) and currency-correlated futures tend to be more active here than equity index futures like ES and NQ
most retail futures traders don't actively trade this session — and for good reason. the average range is significantly smaller, which means there's less to capture. but that doesn't mean the overnight session is irrelevant. what happens here sets the stage for the next morning.
London session (3:00 AM – 11:00 AM ET)
the London session is where things start to wake up. european markets open, volume picks up, and the price action starts establishing the pre-market direction that carries into the US open.
key characteristics:
- increasing volume as european institutional traders come online
- this session often initiates trends that carry into the NY open
- strong FX crossover — if you trade gold (GC), this session matters. forex-correlated futures see more activity during london hours
- pre-market price discovery happens here. gaps from the overnight session start getting addressed
for US futures traders, the london session is worth paying attention to even if you don't trade it. the levels established between 3 AM and 11 AM ET often act as reference points for NY session setups.
NY session (9:30 AM – 4:00 PM ET)
the NY session is where the majority of US futures volume occurs. this is peak liquidity, peak range, and where most of the key setups trigger.
what makes the NY session dominant:
- highest volume of any session across ES, NQ, GC, and most US futures
- major economic news releases (CPI, FOMC, jobs data) hit during this window
- the opening range and initial balance — two of the most data-backed setups in futures trading — happen exclusively in this session
- the most overlap with retail and institutional participation
if you can only trade one session, this is the one the data supports. but even within the NY session, some hours are significantly better than others — we'll break that down below.
what the data shows: average range by session
talking about the best time to trade futures in general terms is one thing. looking at the actual average range across sessions by ticker is another.
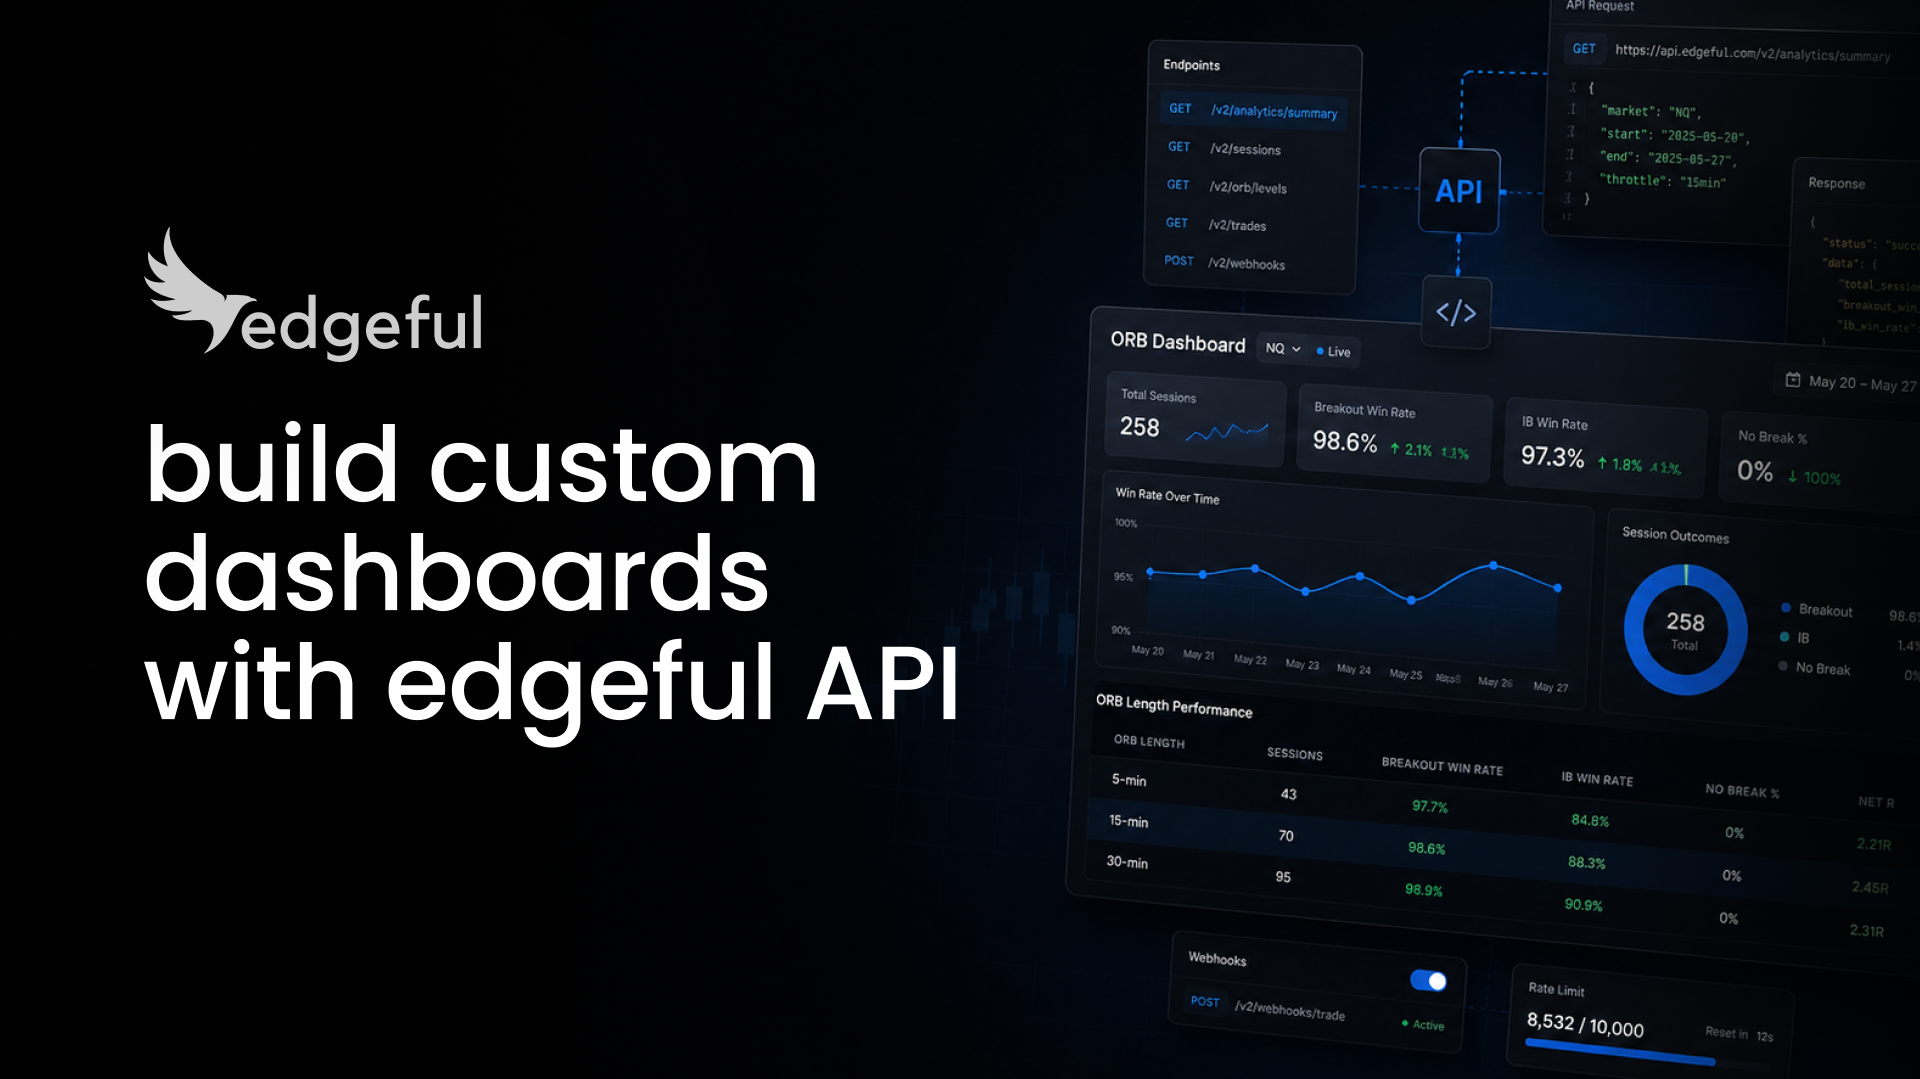
using edgeful's session data and average daily range reports, you can compare how much price moves during each session — broken down by ticker and timeframe. this is the most practical way to answer "when should I trade?"
here's how the sessions compare for the most popular futures contracts:
ES (S&P 500 futures) — 14-day ATR over the last 6 months:
- asia session (7:00 PM – 4:00 AM ET): $79.89 ATR — range exceeded only 12.6% of the time
- london session (3:00 AM – 11:00 AM ET): $93.71 ATR — range exceeded 32.28% of the time
- NY session (9:30 AM – 4:00 PM ET): $95.71 ATR — range exceeded 40.94% of the time
NQ (Nasdaq futures) — 14-day ATR over the last 6 months:
- asia session: $393.89 ATR — range exceeded only 11.81% of the time
- london session: $445.43 ATR — range exceeded 28.35% of the time
- NY session: $449.26 ATR — range exceeded 37.8% of the time
the pattern is clear for ES and NQ: the NY session has the highest ATR and exceeds its range the most often (~38-41% of the time vs. ~12% during the asia session). the asia session is significantly compressed — $79.89 ATR on ES vs. $95.71 during the NY session.
GC (gold futures) — 14-day ATR over the last 6 months:
- asia session (7:00 PM – 4:00 AM ET): $115.67 ATR — range exceeded 21.26% of the time (27 out of 127 days)
- London session (3:00 AM – 11:00 AM ET): $119.24 ATR — range exceeded 21.26% of the time (27 out of 127 days)
- NY session (9:30 AM – 4:00 PM ET): $119.37 ATR — range exceeded 29.13% of the time (37 out of 127 days)
at first glance, gold looks like it behaves similarly across sessions — the base ATR only varies about 3% ($115-119). but look closer at the "range exceeded" numbers. the NY session exceeds its ATR 29% of the time vs. only 21% for london and asia. that means you're almost 40% more likely to get a bigger-than-average range day during the NY session.
but the ATR averages smooth out a detail that matters a lot if you trade GC: the best session for range rotates by day of week.
GC session range by weekday over the last 6 months:
- asia leads on Monday ($78.52 — 29% more range than NY's $60.74)
- london leads on Tuesday ($79.28) and friday ($79.25)
- NY leads on Thursday ($84.68 — the biggest single session range of the week)
- Wednesday is relatively balanced across all three sessions
gold is a global instrument driven by currency flows, not just US equity markets — and the data reflects that. the aggregate ATR across sessions looks similar, but the day-to-day reality is very different. Monday's asia session ($78.52) has nearly 30% more range than its NY session ($60.74). but by Thursday, the NY session ($84.68) is the clear winner.
the practical takeaway: if you trade GC, the NY session does give you the best odds of exceeding the average range (29% vs. 21%). but if you're looking for the biggest raw range on a specific day, it depends on the day of week — and edgeful's session range by weekday report shows you exactly which windows are producing the most movement.
this doesn't mean the asia session is useless for equity index futures. but if you're trading ES or NQ and looking for range, the data tells you exactly when that's happening.
which edgeful reports help you find the best time to trade futures
this is where finding the best time to trade futures gets practical. different sessions produce different types of setups — and different edgeful reports are designed to capture them.
NY session reports
the NY session is where the majority of edgeful's reports are most useful:
- opening range breakout (ORB) — the first 5, 15, or 30 minutes of the NY session define the opening range. the ORB report shows you how often price breaks out of that range and follows through. this is one of the most widely used reports on the platform, and the data is specific to the NY session
- initial balance (IB) — the first 60 minutes of the session. the IB report tells you how often price breaks above or below the IB range and continues. this is critical for building a directional bias early in the day
- session breakout — how often price makes new session highs or lows after a specific time. this report helps you decide whether to hold a trade or take profit based on time-of-day data
if you're trading the NY session, these three reports alone give you a data-backed framework for the first few hours of the trading day.
overnight → NY open reports
the gap between where the prior session closed and where the NY session opens creates some of the most consistent setups in futures trading:
- gap fill — the gap fill report measures how often price fills the gap back to the prior session close. this setup starts at the NY open but the overnight session is what creates it
- market session correlation — how does one session's direction carry into the next? according to edgeful data, over the last 6 months, when GC's london session closes green, the NY session follows green 81% of the time. this report connects what happened during earlier sessions to what's likely at the next open
london session reports
- session breakout (london hours) — the session breakout report can be filtered to the london session. if you're actively trading european hours, this data helps you understand how often london-session moves follow through vs. reverse at the NY open
the key point: you don't need to trade every session to find the best time to trade futures. knowing which reports apply to each session means you're using the right data at the right time.
the best times to trade within the NY session
the NY session is the best time to trade futures overall — but even within it, not all hours are equal. here's what the data shows about the most important windows.
the opening range (first 15-30 minutes)
the opening range is the price range established in the first 5, 15, or 30 minutes of the NY session. it's one of the most studied setups in futures trading — and for good reason.
edgeful's ORB report tracks how often price breaks above or below the opening range and follows through in a single break, double break, or no break. the data is broken down by ticker, timeframe, and session conditions.
over the last 6 months (127 days), the 15min ORB by-close data shows how strongly the opening range sets the tone for the rest of the day:
- ES: closed above ORB high 43.31% of the time, below ORB low 36.22%. only 20.47% of days closed inside the opening range
- NQ: closed above ORB high 44.88%, below ORB low 32.28%. only 22.83% closed inside the range
nearly 80% of the time, both ES and NQ commit to a direction by the session close. the first 15 minutes of the session set the tone. if you're a day trader and you can only be at your desk for one window, this is the one to prioritize.
the initial balance (first 60 minutes)
the initial balance is the high and low of the first 60 minutes. once the IB is established, traders use it as a reference range for the rest of the day.
edgeful's IB report shows how often price breaks above or below the IB and continues in that direction. the IB extension and by-levels subreports add even more detail — showing you how far price typically travels once the IB breaks.
over the last 6 months (127 days), the IB data reinforces why the first 60 minutes matter:
- ES: single IB break 74.02% of the time — nearly 3 out of 4 days, ES breaks one side and commits to that direction for the rest of the session
- NQ: single IB break 79.53% of the time — nearly 4 out of 5 days
the 9:30 AM – 10:30 AM ET window (for equity futures) is when the IB forms. this is prime time for building your directional bias.
power hour (3:00 – 4:00 PM ET)
power hour has a reputation for big moves. the reality is a bit different.
edgeful's data shows that new session highs and lows during the final hour are less common than most traders expect. the power hour breakout report breaks this down — and the data is worth checking before you assume the last hour is going to give you a clean trend.
over the last 6 months (122 days), ES and NQ both show the same pattern during power hour:
NQ:
- new high of day made during power hour: 20.49% of the time
- new low of day made during power hour: 13.93% of the time
ES:
- new high of day made during power hour: 20.49% of the time
- new low of day made during power hour: 13.11% of the time
that means roughly 4 out of 5 days, the high of the day is already in before 3:00 PM. and the low of the day is already in nearly 87% of the time. if you're holding for a breakout move in the last hour, the odds are against you most days.
why day of week matters for finding the best time to trade futures
you can pick the right session and the right time window — but if you treat every day the same, you're still missing a big piece of the puzzle.
volume and range aren't consistent across the week. the data shows that range builds through the week and peaks on thursday/friday for US equity index futures. mondays are consistently the smallest range day. the conventional wisdom about tuesday/wednesday being the best days doesn't match what the numbers actually show.
edgeful's volume and range by weekday report tracks this across every ticker. when you layer day-of-week data on top of session data, you get a much clearer picture of when your trading has the highest likelihood of working.
we covered this in detail in our volume and range by weekday report guide — it's worth reading if you haven't already.
over the last 6 months, here's how ES and NQ NY session range breaks down by day of week:
- ES: Monday $60.86 → Tuesday $64.82 → Wednesday $66.87 → Thursday $74.68 → Friday $74.10
- NQ: Monday $302.18 → Tuesday $303.79 → Wednesday $343.83 → Thursday $369.64 → Friday $377.23
how to find your best trading window
there's no single best time to trade futures that works for every trader. the answer depends on your schedule, your ticker, and the type of setups you trade. but here's a practical process for figuring it out:
- match your schedule to session structure. if you can only trade from 9:00 AM – 12:00 PM ET, that's the heart of the NY session — great. if you're in a timezone where you're up during london hours, that's a different opportunity. start with when you're actually available
- pull session data for your preferred ticker. on edgeful, look at the ORB, IB, gap fill, and session breakout reports for your ticker. filter by session and timeframe. this tells you what's working right now — not what worked 2 years ago
- compare range across sessions. use the ADR and session data to see which windows produce the most range. more range means more opportunity — but also more risk. match your risk tolerance to the session
- build a routine around the data. once you've identified your best window, commit to it. trade the same session, the same setups, for at least 30 days before expanding. consistency is what makes the data work for you
if you want a step-by-step morning system, check out our 3-minute day trading routine.
common mistakes when choosing the best time to trade futures
mistake 1: trading the overnight session the same way you trade the NY session
the overnight session has a fraction of the volume and range. applying the same strategies, the same risk parameters, and the same expectations to the Asia session that you use during the NY session is a mismatch. the data confirms this — the average range during overnight hours is significantly smaller for ES and NQ.
if you're going to trade overnight, adjust your targets, your stops, and your expectations to match the session's actual behavior.
mistake 2: ignoring what happened before the NY open
pre-market price action isn't just noise. the levels established during the london session, the overnight high and low, and the gap from the prior close all feed directly into NY session setups.
traders who only look at the chart starting at 9:30 AM are missing context. the gap fill report, overnight continuation report, and session breakout data all rely on what happened before the bell.
mistake 3: expecting big moves in the last hour
this is a common one — traders hold positions into power hour expecting a strong close. the data shows that new session highs and lows during the final hour are less frequent than during the first 2 hours of the session.
that doesn't mean you should never trade power hour. it means you should check the data first and set realistic expectations for what the last hour typically delivers.
key takeaways
- the best time to trade futures is session-dependent — the NY session produces the largest average range for ES and NQ, but GC requires a more nuanced approach
- ES and NQ: NY session consistently dominates. ES NY ATR: $95.71 (exceeded 41% of the time) vs. asia $79.89 (exceeded 12.6%). NQ NY ATR: $449.26 vs. asia $393.89
- GC: the base ATR is similar across sessions (~$115-119), but the NY session exceeds its ATR 29% of the time vs. 21% for london and asia — almost 40% more likely to get an above-average range day. when you break it down by weekday, the best session rotates: asia leads Monday ($78.52), london leads Tuesday/Friday, NY leads Thursday ($84.68)
- the first 60 minutes of the NY session (ORB + IB) is consistently the highest-opportunity window for day traders
- different edgeful reports work best in different sessions — ORB and IB for the NY open, gap fills for overnight-to-open, market session correlation for connecting london direction to NY
- day of week matters — for ES/NQ, Thursday/Friday produce the largest range while Monday is consistently the most compressed. ES Thursday NY range ($74.68) is 23% larger than Monday ($60.86)
- don't trade the asia session with NY session expectations — adjust your strategy to match the data for each session
- always check session data for your specific ticker — what works for ES doesn't necessarily apply to GC
- consistency matters more than coverage — once you've found the best time to trade futures for your setup, trade it for 30 days, then expand based on what the data shows
edgeful provides historical performance data to help traders make informed decisions. this does not constitute financial advice. past performance is not indicative of future results. all trading involves risk — always do your own analysis and manage your risk accordingly. the data in these tables and images is subject to change, which is why double checking the edgeful reports is a requirement if you're going to trade with data.
FAQs